6 Using the product
106 0970 4020 en 01 testo AG
Pos: 142 /TD/Produ kt verwenden/testo Sa veris/05a-2 Kur veneigenschaften/03 Register Datenreihe @ 0\mod _1188996704453_79.doc @ 3646
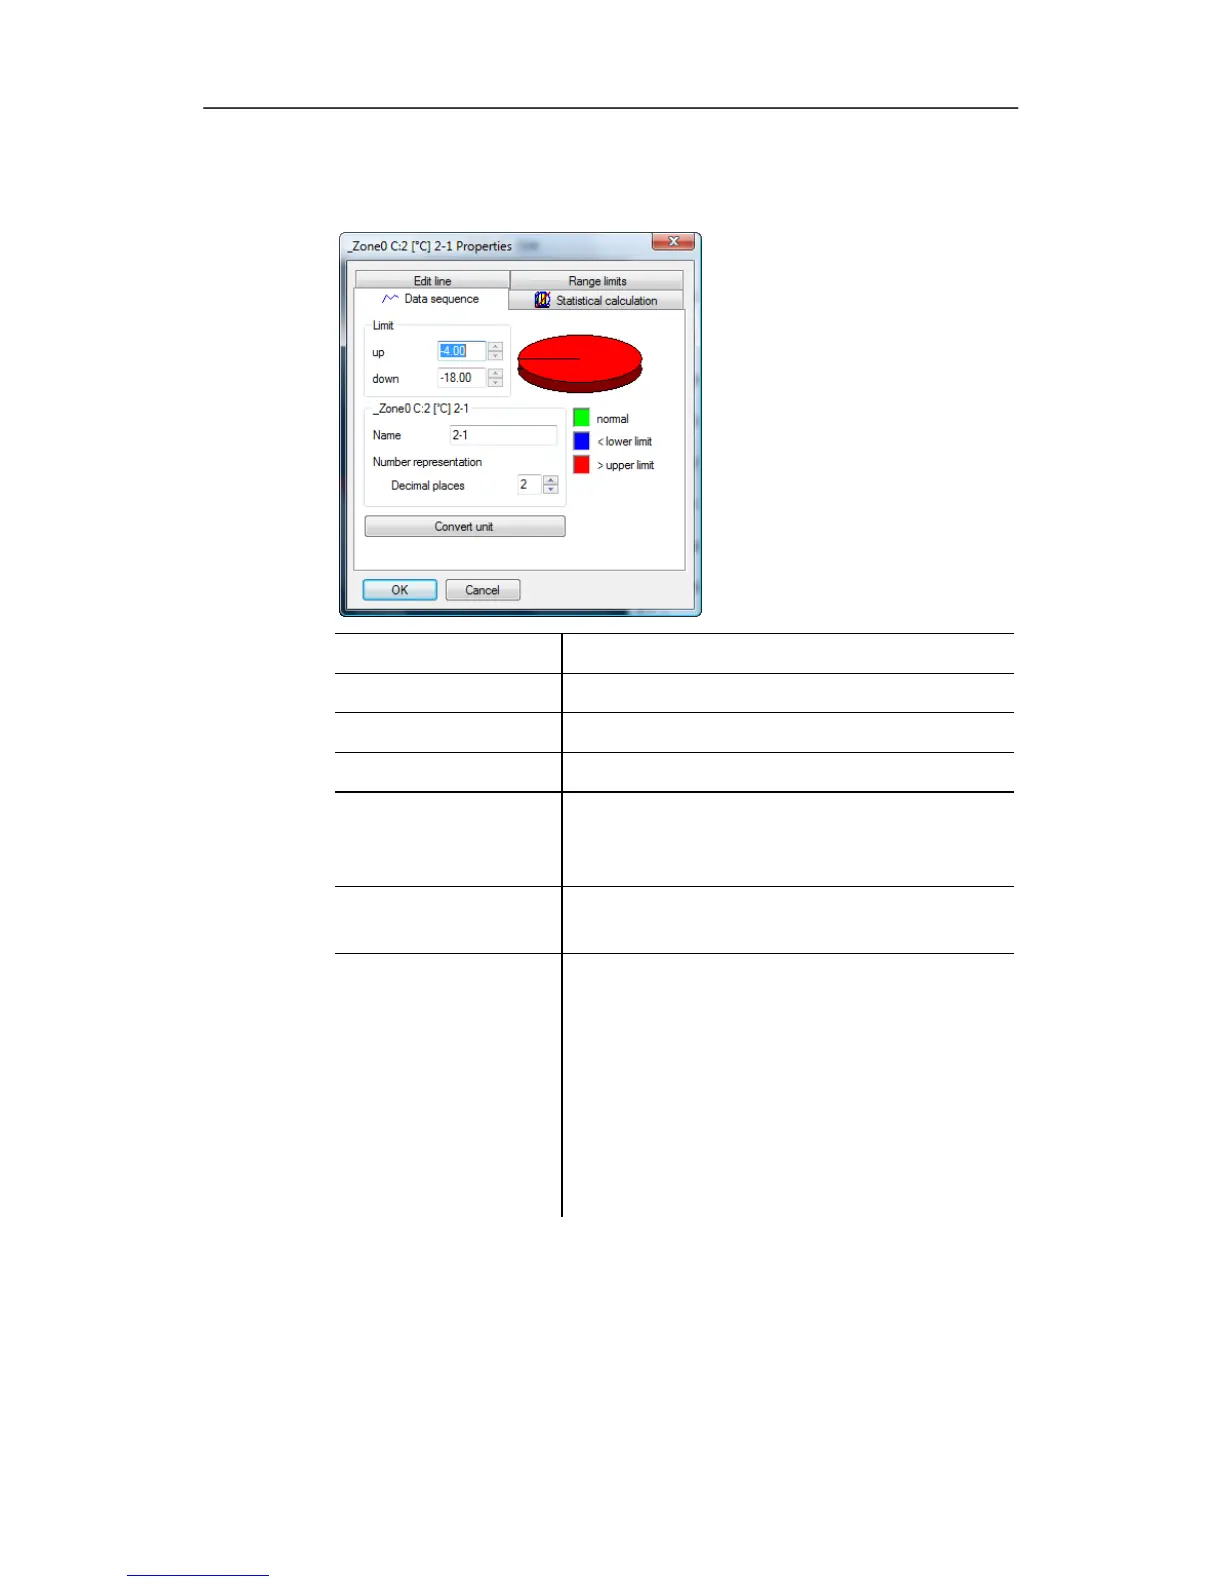
Data sequence tab
Designation Explanation
Upper limit values
Specification of the upper limit value.
Lower limit values
Specification of the lower limit value.
Name
Designation of curve.
Decimal places
number
representation
Number of the decimal places; e.g. for the
data table. Possible values "0" to "6".
[Convert unit] Opens a dialogue for converting the unit
of the curve.
Pie chart Graphical representation for the
distribution of the readings:
• green: readings that are within the
limit values.
• blue: readings that are below the
lower limit value.
• red: readings that are above the
upper limit value.
 Loading...