mA OUTPUT
FIELD CALIBRATION
CHEMICAL CURVE
n
D
CCD
TEMP
Pt-1000
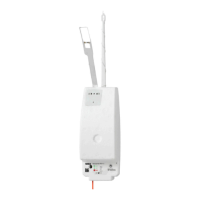
Indicating
transmitter
DTR
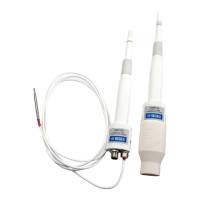
Sensor
CONC
CALC
1.
2.
3.
4.
5.
6.
DAMPING
Figure 39 Concentration calibration layers
1 The information from the CCD element and the Pt-1000 temperature element. The
position of the shado
w edge, see Figure 143 (page 259), is described by a number called
CCD and scaled 0 … 100 %.
2 Sensor calibration: The actual refractive index n
D
is calculated from the CCD value. The
process temperature is calculated from the Pt-1000 resistance. The sensor output is n
D
and temperature TEMP in degrees Celsius. The calibrations of all sensors are identical,
which makes sensors interchangeable. The calibration of each sensor can be verified
using standard refractive index liquids.
3 Chemical curve: The indicating transmitter DTR receives n
D
and TEMP and calculates the
concentration value according to chemical curves. The result is a temperature-
compensated calculated concentration value CALC.
Chapter 7 – C
onfiguration and calibration
73
 Loading...