Chapter 3 Monitor
EMG2306-R10A User’s Guide
22
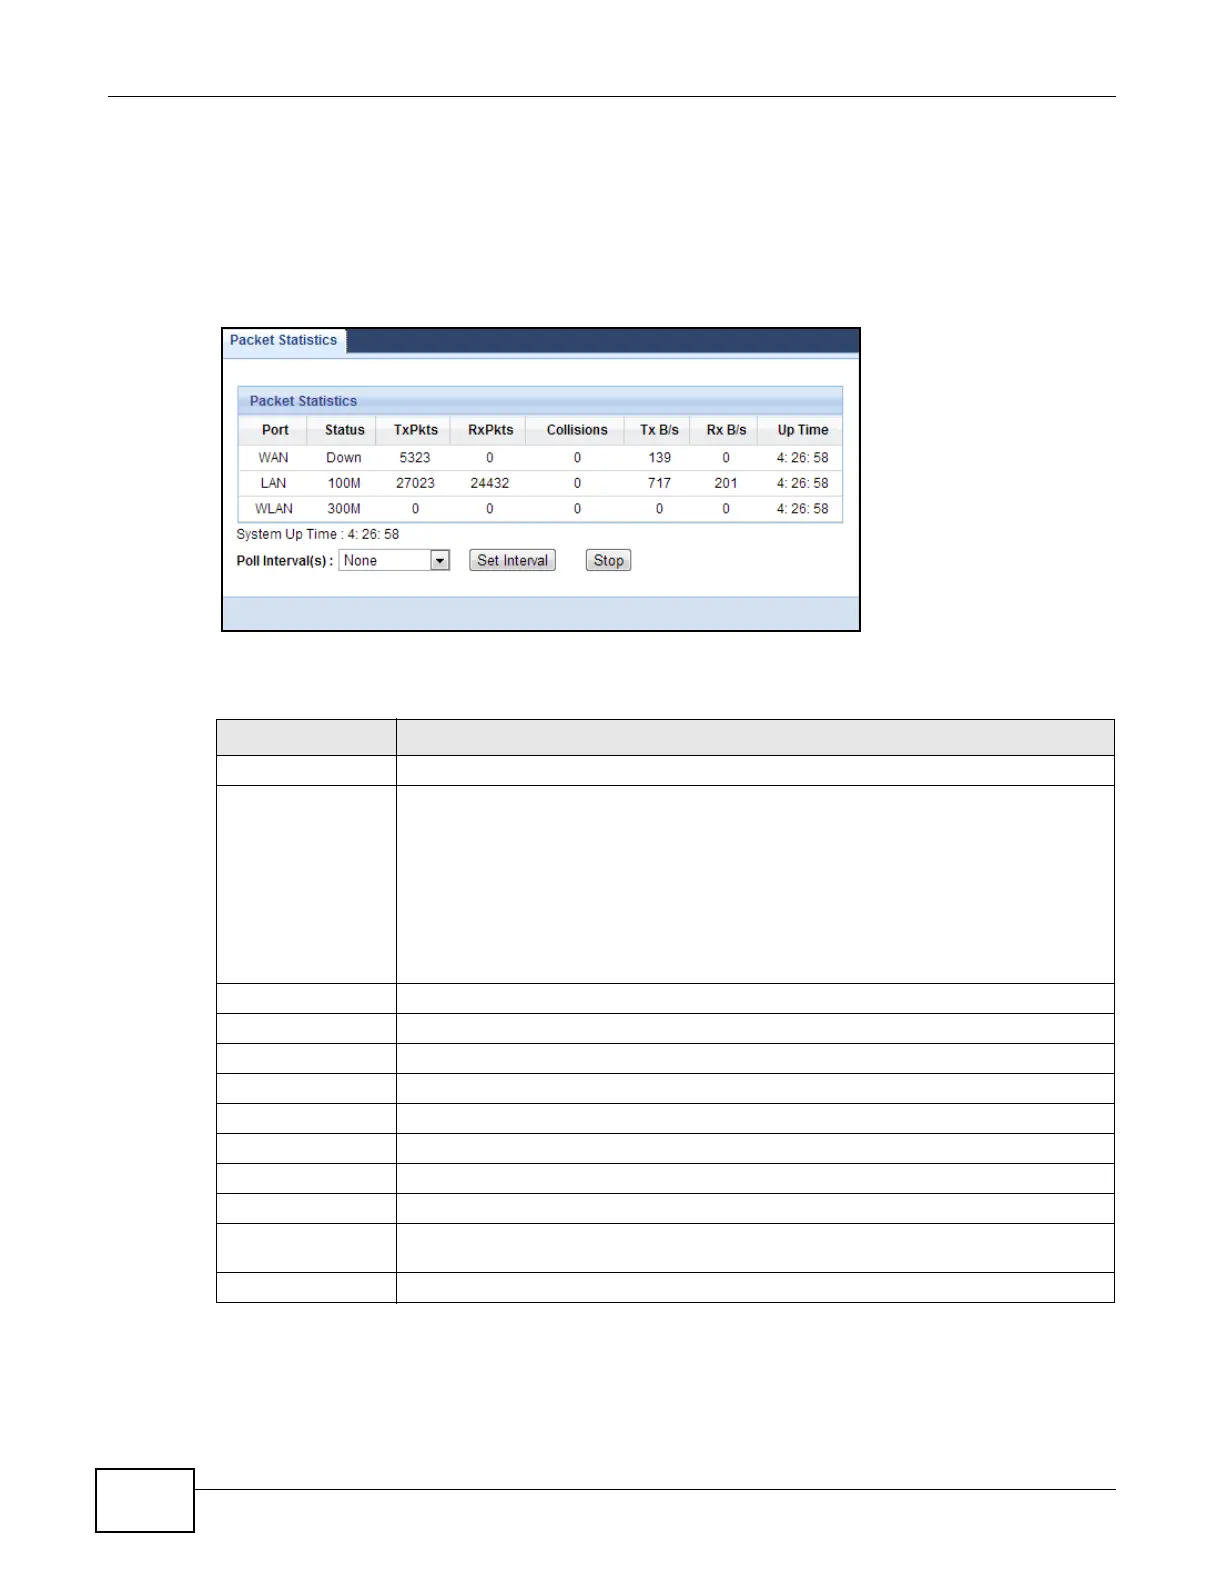
3.5 Packet Statistics
Click the Packet Statistics (Details...) hyperlink in the Status screen or Monitor > Packet
Statistics. Read-only information here includes port statistics and the "system up time". The Poll
Interval(s) field is configurable and is used for refreshing the screen.
Figure 8 Summary: Packet Statistics
The following table describes the labels in this screen.
Table 6 Summary: Packet Statistics
LABEL DESCRIPTION
Port This is the EMG2306-R10A’s port type.
Status For the LAN ports, this displays the port speed and duplex setting or Down when the
line is disconnected.
For the WAN port, it displays the port speed and duplex setting if you’re using Ethernet
encapsulation and Idle (line (ppp) idle), Dial (starting to trigger a call) and Drop
(dropping a call) if you’re using PPPoE or PPTP encapsulation. This field displays Down
when the line is disconnected.
For the WLAN, it displays the maximum transmission rate when the WLAN is enabled
and Down when the WLAN is disabled.
TxPkts This is the number of transmitted packets on this port.
RxPkts This is the number of received packets on this port.
Collisions This is the number of collisions on this port.
Tx B/s This displays the transmission speed in bytes per second on this port.
Rx B/s This displays the reception speed in bytes per second on this port.
Up Time This is the total time the EMG2306-R10A has been for each session.
System Up Time This is the total time the EMG2306-R10A has been on.
Poll Interval(s) Enter the time interval in seconds for refreshing statistics in this field.
Set Interval Click this button to apply the new poll interval you entered in the Poll Interval(s)
field.
Stop Click Stop to stop refreshing statistics.

 Loading...