Fault removal
multi EA 4000 Version 01.16 109
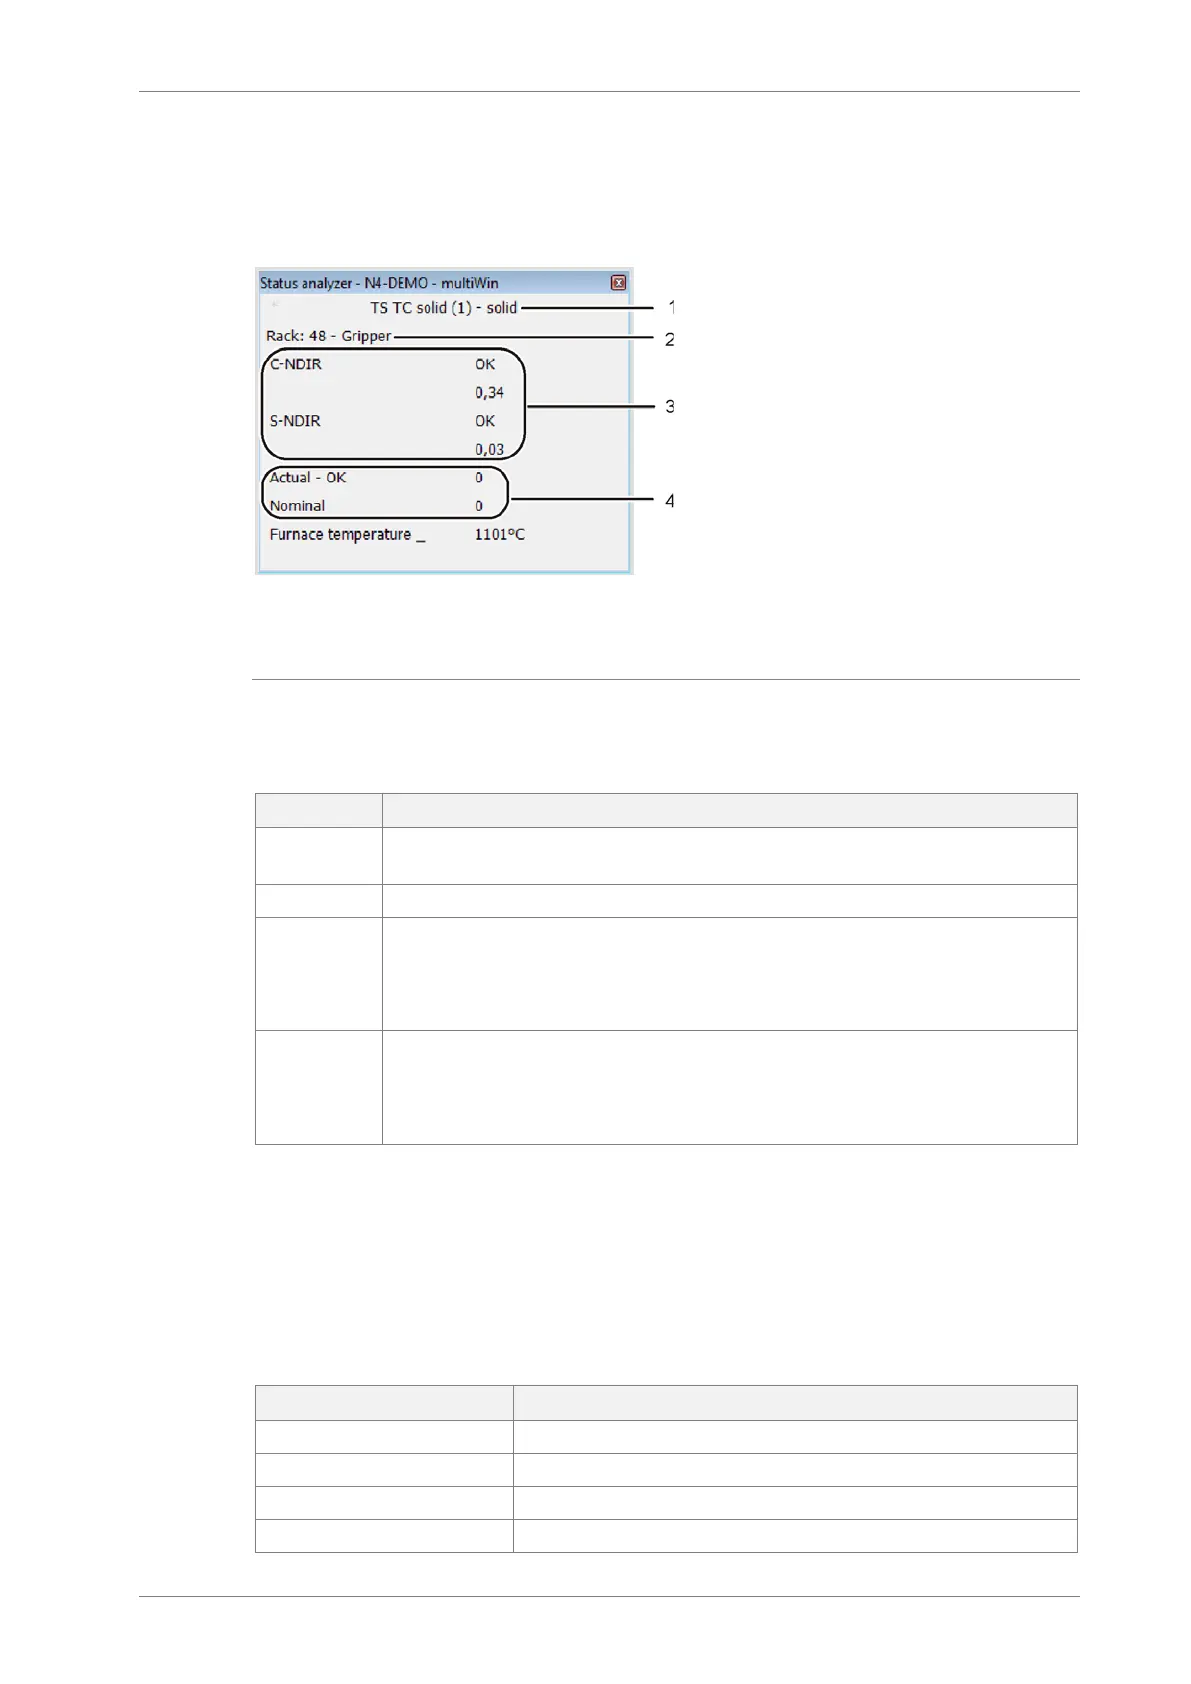
9.3 Indications in the window DEVICE STATE
In the window STATUS ANALYZER Information on the device status or individual modules is
displayed.
analysis module / sampler
detection/sensor module
4 flow indication (not for Cl measurements)
5
temperature indication
Fig. 33 Window STATUS ANALYZER
The displays in the STATUS ANALYZER window are indicated in color. The colors have the
following meanings:
Black Status of the corresponding component is ok, device is ready for measure-
ment
Gray Detector is inactive
Green Detector is ok, device is ready for measurement (OK)
or
Detector is busy, a measurement can only be started once the routine is
complete (detector-specific)
Red Component is not ready for measurement
Warm-up time not yet complete ⇒ wait until warm-up time is complete
Error ⇒ Error search, find information on corresponding components in mul-
tiWin via the menu item
SYSTEM / COMPONENT TEST
In the top line of the window S
TATUS ANALYZER the name of the active method and the sam-
ple state (solid) are displayed.
During initialization it is detected whether the sampler FPG 48 is connected and switched on.
In this case the display "Rack 48" appears. A connected automatic TIC solids module is also
detected and displayed as "TIC (automatic)".
All the detector modules that are identified during initialization are displayed in the Detec-
tion/Sensor Module area. The following displays are possible:
C-NDIR NDIR detector for carbon
S-NDIR NDIR detector for sulfur
Cl-AMP smallCell Chlorine module with "sensitive" cell
Cl-AMP largeCell Chlorine module with "high concentration" cell