Tightening
378 9836 3521 01
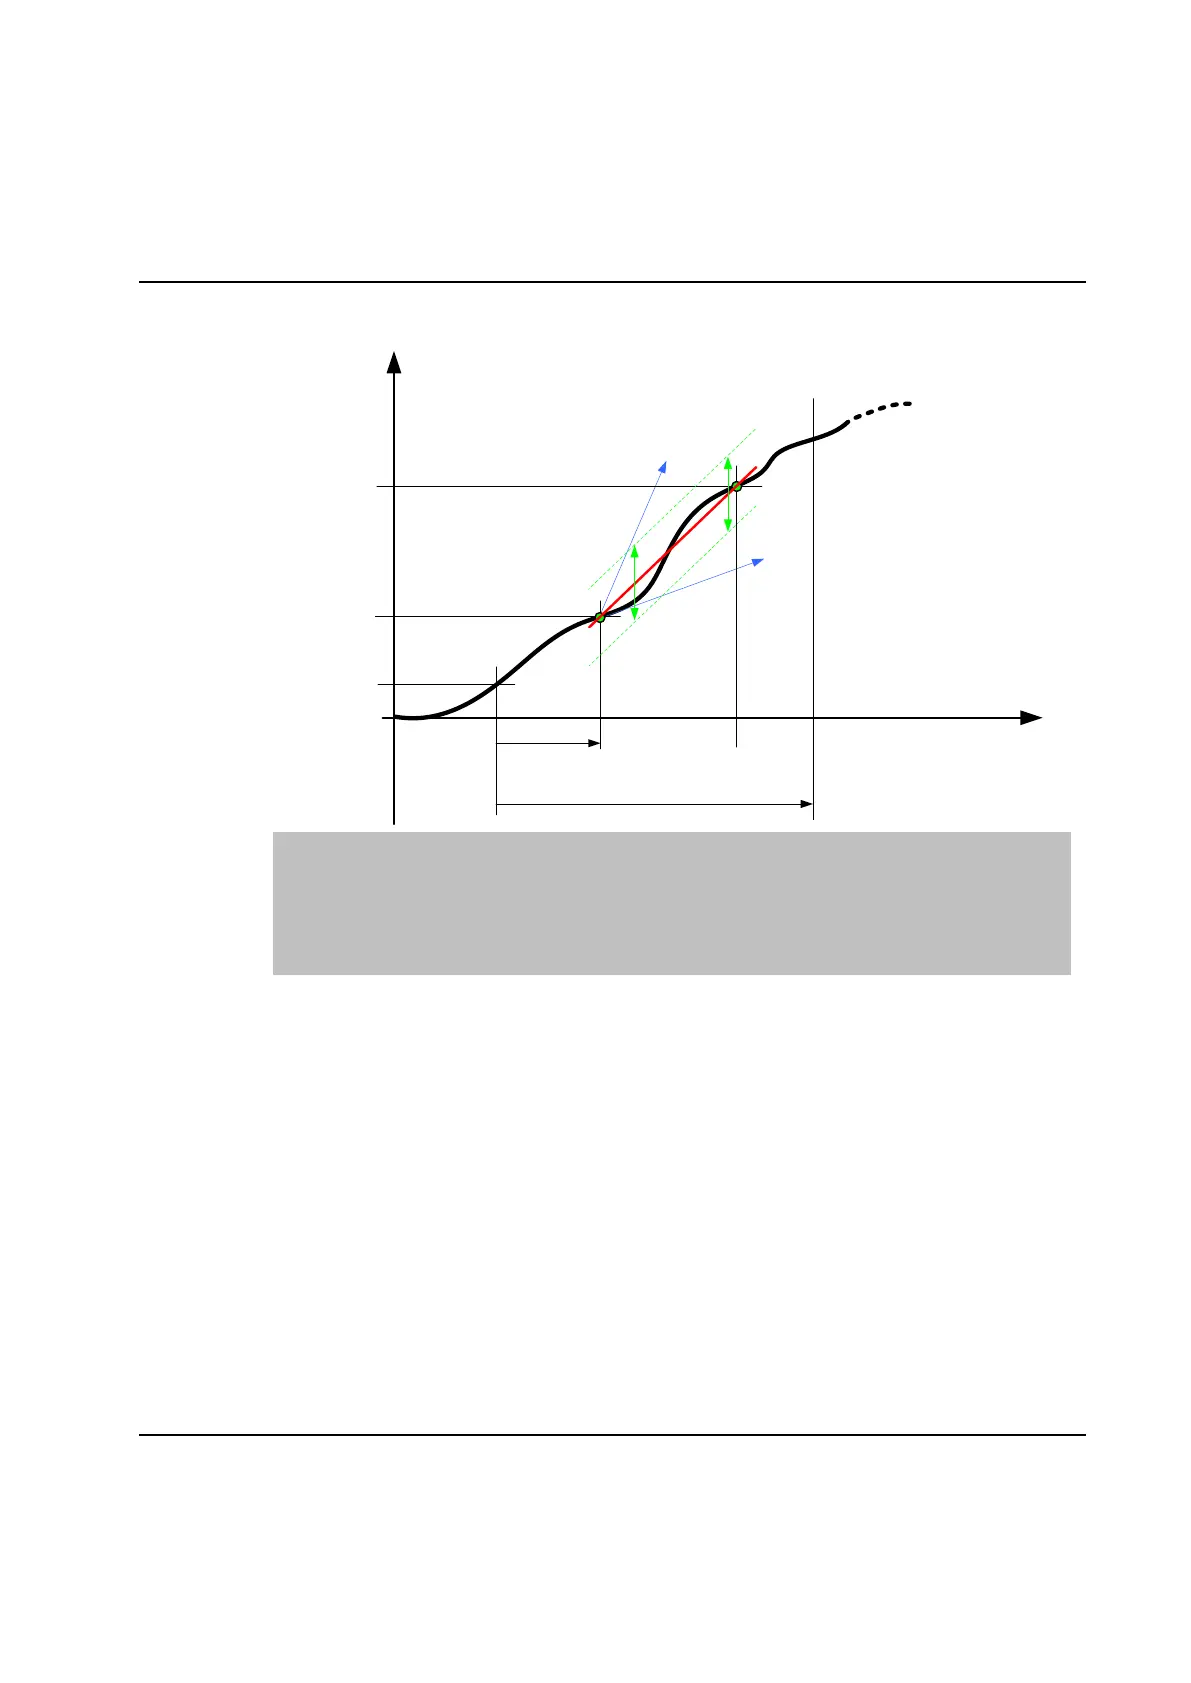
Diagram 2:
Angle
Torque
Tstart Torque Start Astart Angle Start Dev Deviation
Tstop Torque Stop Astop Angel Stop TRL Torque Rate Low
TRH Torque Rate High
T1 Torque at the end of Astart
A2 Angle at Tstop
Tstart
T1
Astart
Astop
A1
A2
Dev
TRH
TRL
Tstop
Result var.: "Bolt TR 1", "Bolt TR 2", "Bolt TR Dev 1", and "Bolt TR Dev2".
Alarms: Torque rate in interval 1 too high (TR1HM),
Torque rate in interval 1 too low (TR1LM)
Torque rate in interval 2 too high (TR2HM)
Torque rate in interval 2 too low (TR2LM)
Too big deviation in interval 1 (DEV1M)
Too big deviation in interval 2 (DEV2M)
Trace: TRH and TRL are shown in trace as lines originating from T1 showing the selected torque
rate. The TRH and TRL lines end where either T2 or A2 should have been reached using
the specified torque rates (see above diagrams). The deviation limit lines are drawn the
distance Dev from, and parallel to, the line between (A1, T1) and (A2, T2). The lines are
only shown when Torque vs. Angle is selected and Monitoring limits are enabled in the
trace form (see View of trace curves).
 Loading...