Basic Functions
9836 3521 01 67
If there is a subgroup, which has possible corrupt data, you can delete it. Click in the diagram on the
subgroup you want to delete. Press Delete Subgroup. This is possible only when the selection SPC and
TDA is active.
To the left current capability values are displayed. The window is automatically updated whenever a new
cycle is completed. Values displayed are calculated over same data as shown in the curve, for subgroups
or for short-term trend.
If Cp or Cpk is not presently within limits, a warning message is presented.
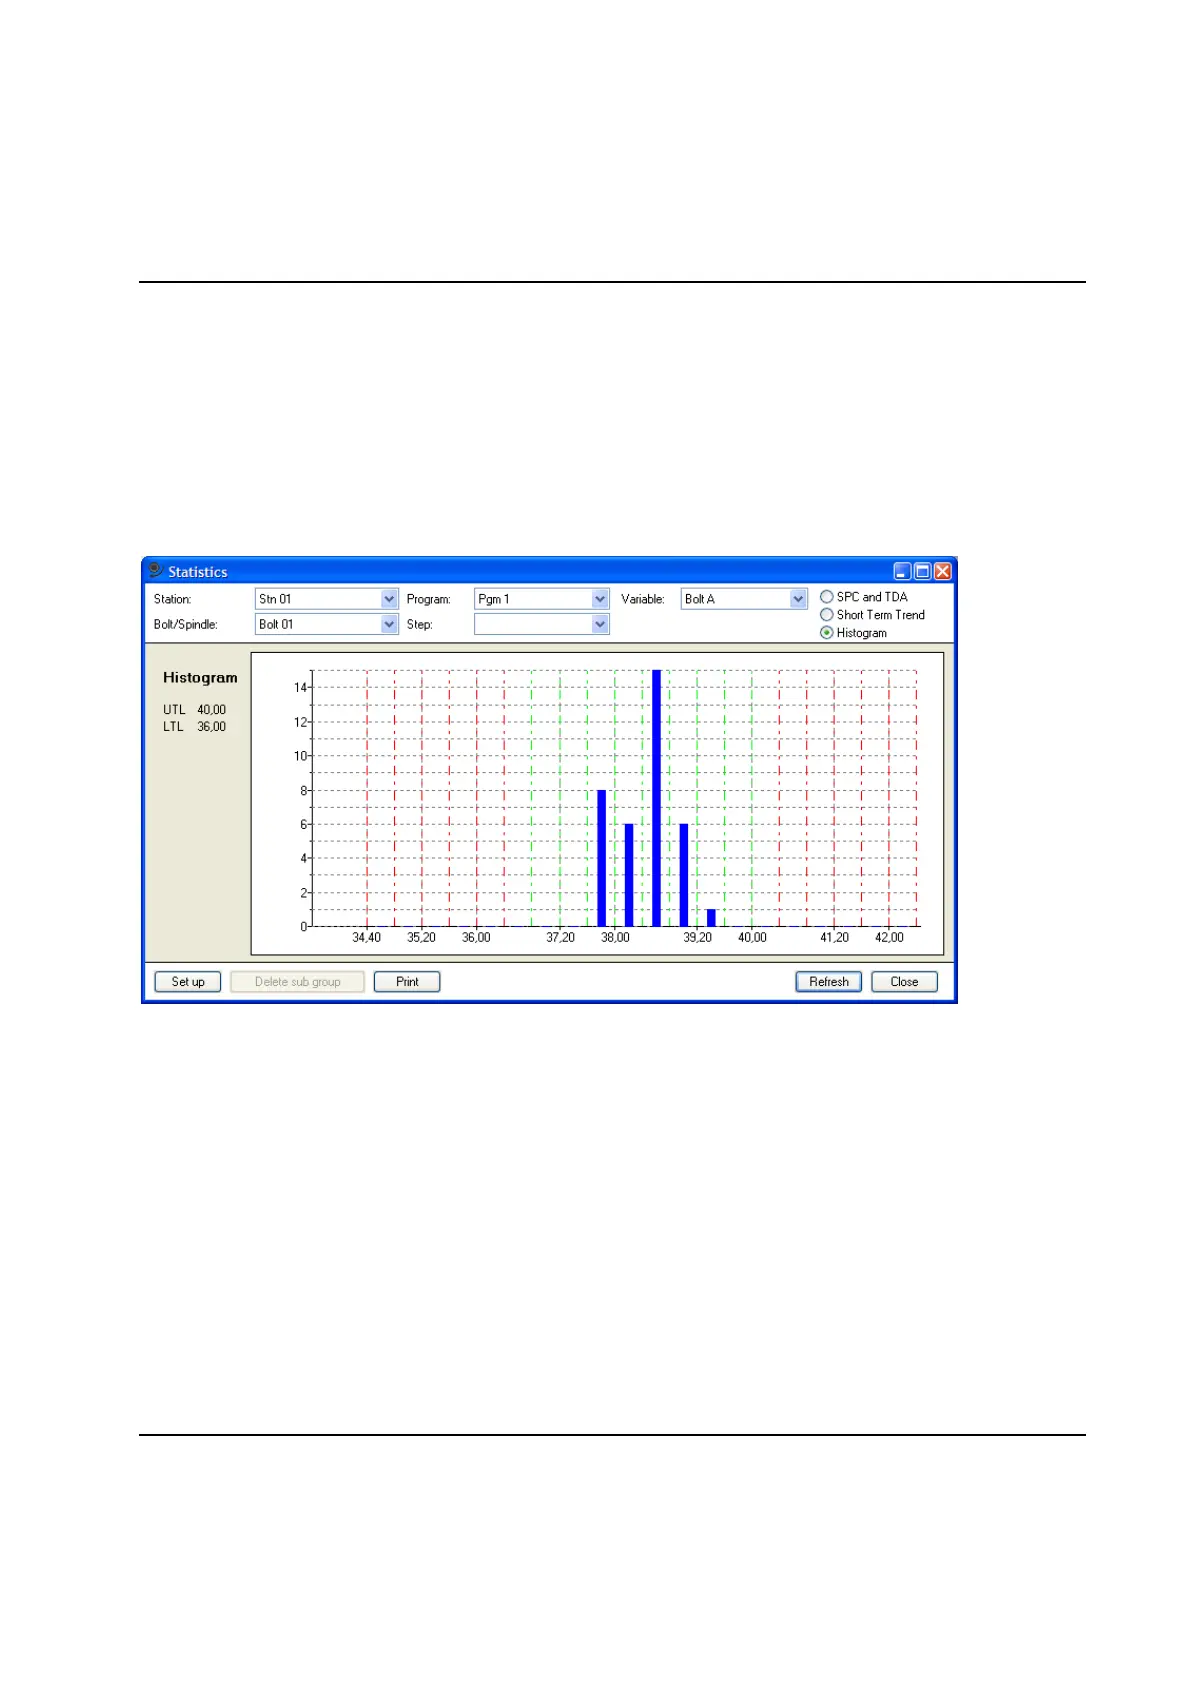
If you select Histogram you will be presented the following view:
This form displays the frequency distribution of the selected variable. The X-axis, displayed in the unit of
the variable, is divided in 20 classes scaled so that 25% of the screen is left of LTL, and 25% is right of
UTL.
The boundaries of each class are marked using dashed vertical lines where green indicates classes in
between LTL and UTL.
On Y-axis is shown the count of values with in each of the classes.
If you want to have the current view on paper, press Print.
The viewed statistics is updated cyclically when online.
 Loading...