Chapter 7: Running Samples with BD FACSDiva Software 119
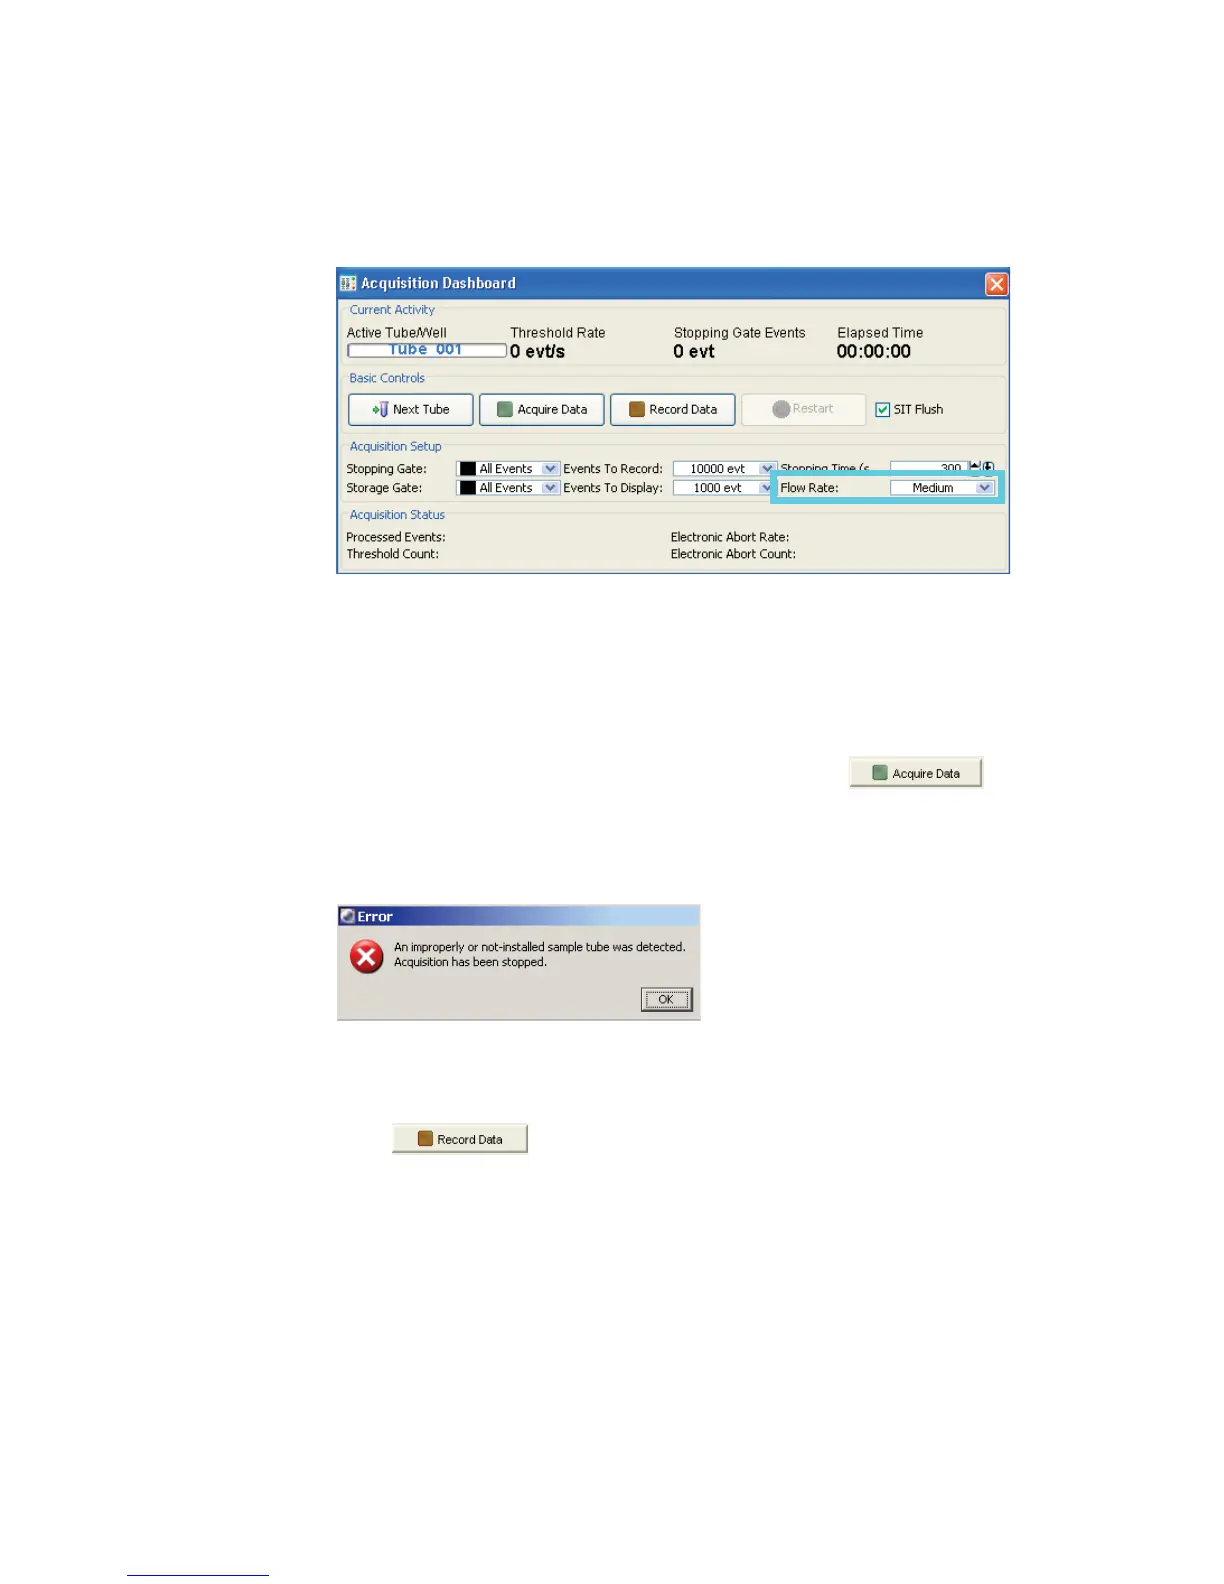
Figure 7-2 Acquisition Dashboard showing Acquisition Setup
• Low = approximately 10 L/min of sample
• Medium = approximately 60 L/min of sample
• High = approximately 120 L/min of sample
3 Move the current tube pointer to the first tube. Click .
If the tube is not fully seated, the following error message appears. Click
OK. Remove the tube and repeat step 1 to properly reinstall it.
4 While data is being acquired, draw a gate around the lymphocytes; set the
other plots to show data from the lymphocyte population.
5 Click .
 Loading...


