122 BD FACSCanto II Instructions for Use
Analyzing Data
1 Create a new global worksheet; rename it TBNK Analysis.
2 Select the first tube under the LWB specimen and create the following dot
plots: FITC vs SSC, APC vs PE-Cy7, APC vs PE, APC vs APC-Cy7, and
APC vs PerCP-Cy5.5.
3 Resize the plots so they fit on one page.
Tip By default, the plots will fit on one page if you select three across.
4 On the FITC vs SSC plot, draw a gate around the lymphocytes; use the
Population Hierarchy to rename the population Lymphocytes.
5 Select all plots except the FITC vs SSC plot and specify to show only the
Lymphocyte population.
Hold down the Control key while you select successive plots. Once all plots
are selected, click the checkbox next to Lymphocytes in the Plot Inspector.
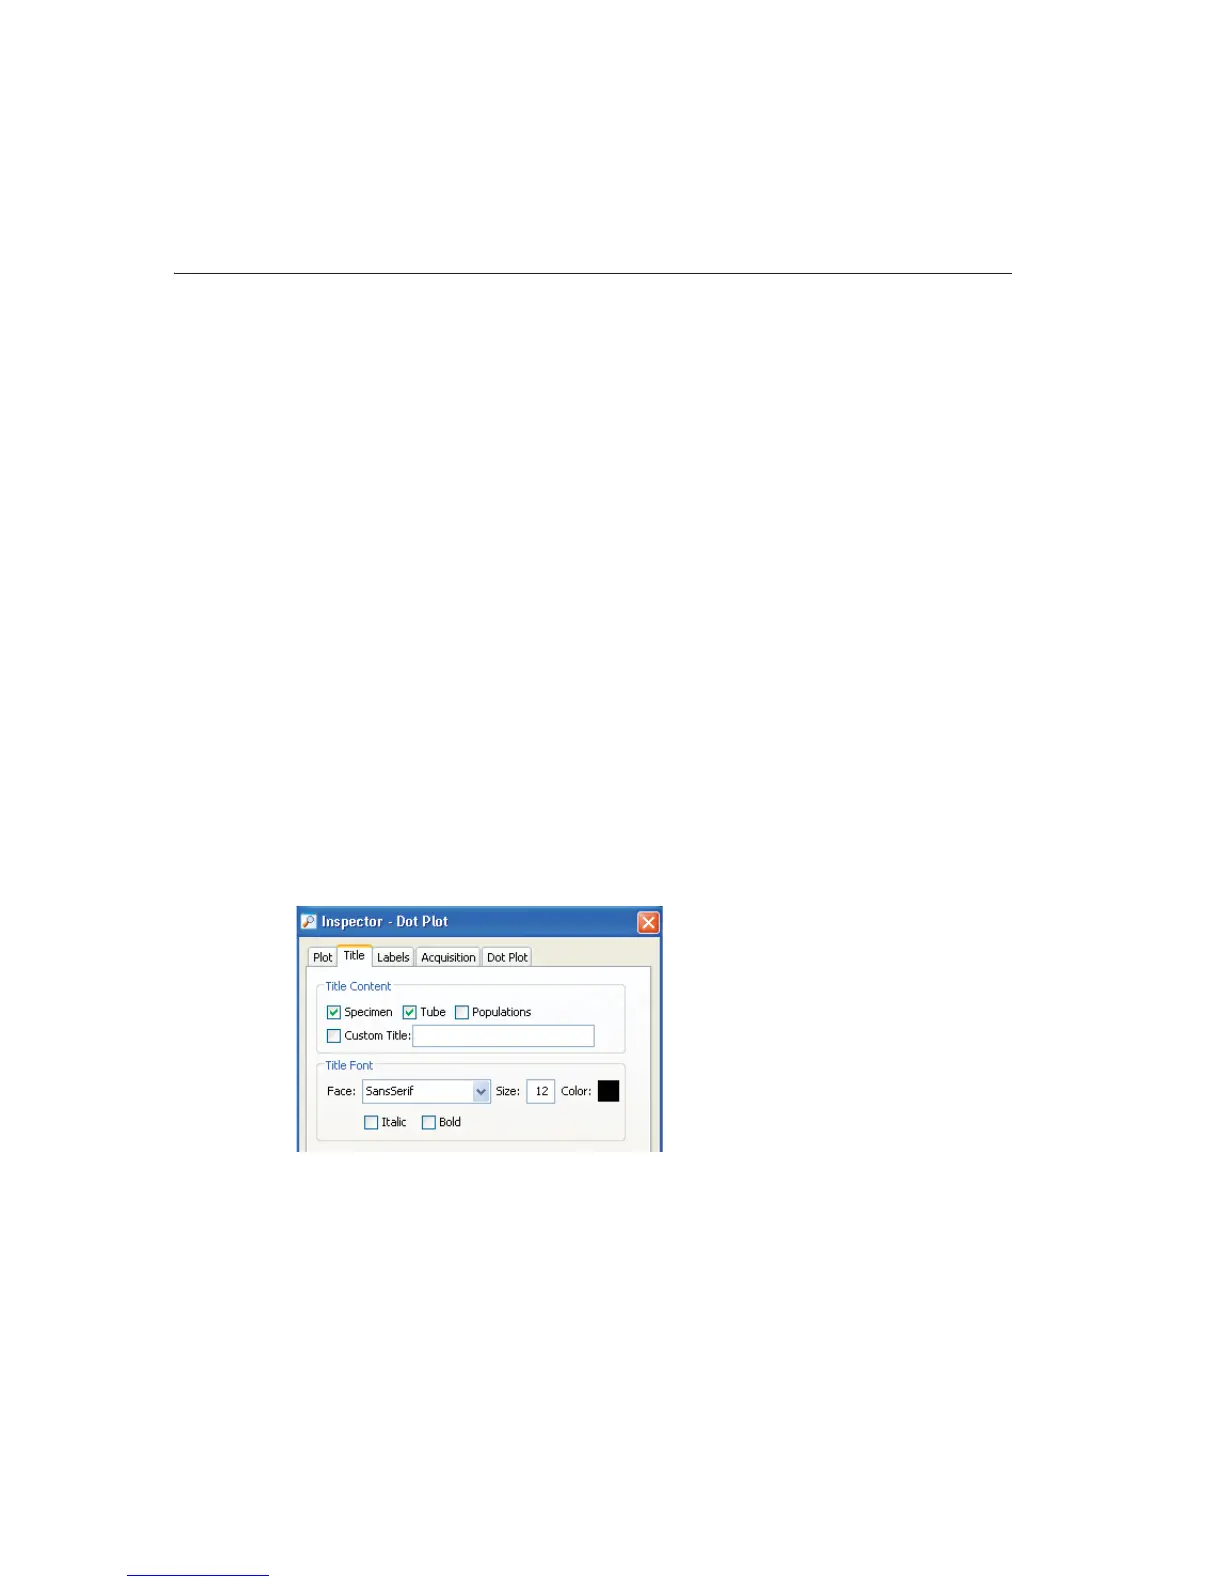
6 Select all plots and click the Title tab in the Plot Inspector; select the
checkboxes to display the tube and specimen names in the plot titles.