- 67 -
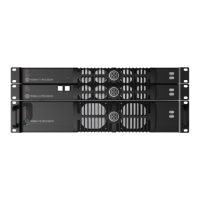
Figure 6-6. Test pattern showing colour bars at 75% and the corresponding Linear RGB
histogram.
The above picture shows a test pattern and its corresponding Linear RGB histogram. Note
that there are clear columns at 75% for each of the three primaries. This is because all of the
colours are either primary colours at 75% (red, green and blue sections) or secondary colours
made from combinations of the primaries at 75% (cyan, yellow, magenta and white sections).
There is also a large peak at 0% on the left which shows how much black there is in the image
(quite a lot) and also a clear peak on the right which shows an area of 100% RGB and is
caused by the single block of 100% white towards the bottom left of the image (you can see
this white is noticeably brighter than the grey-looking vertical section white is made by
mixing 75% red, green and blue).
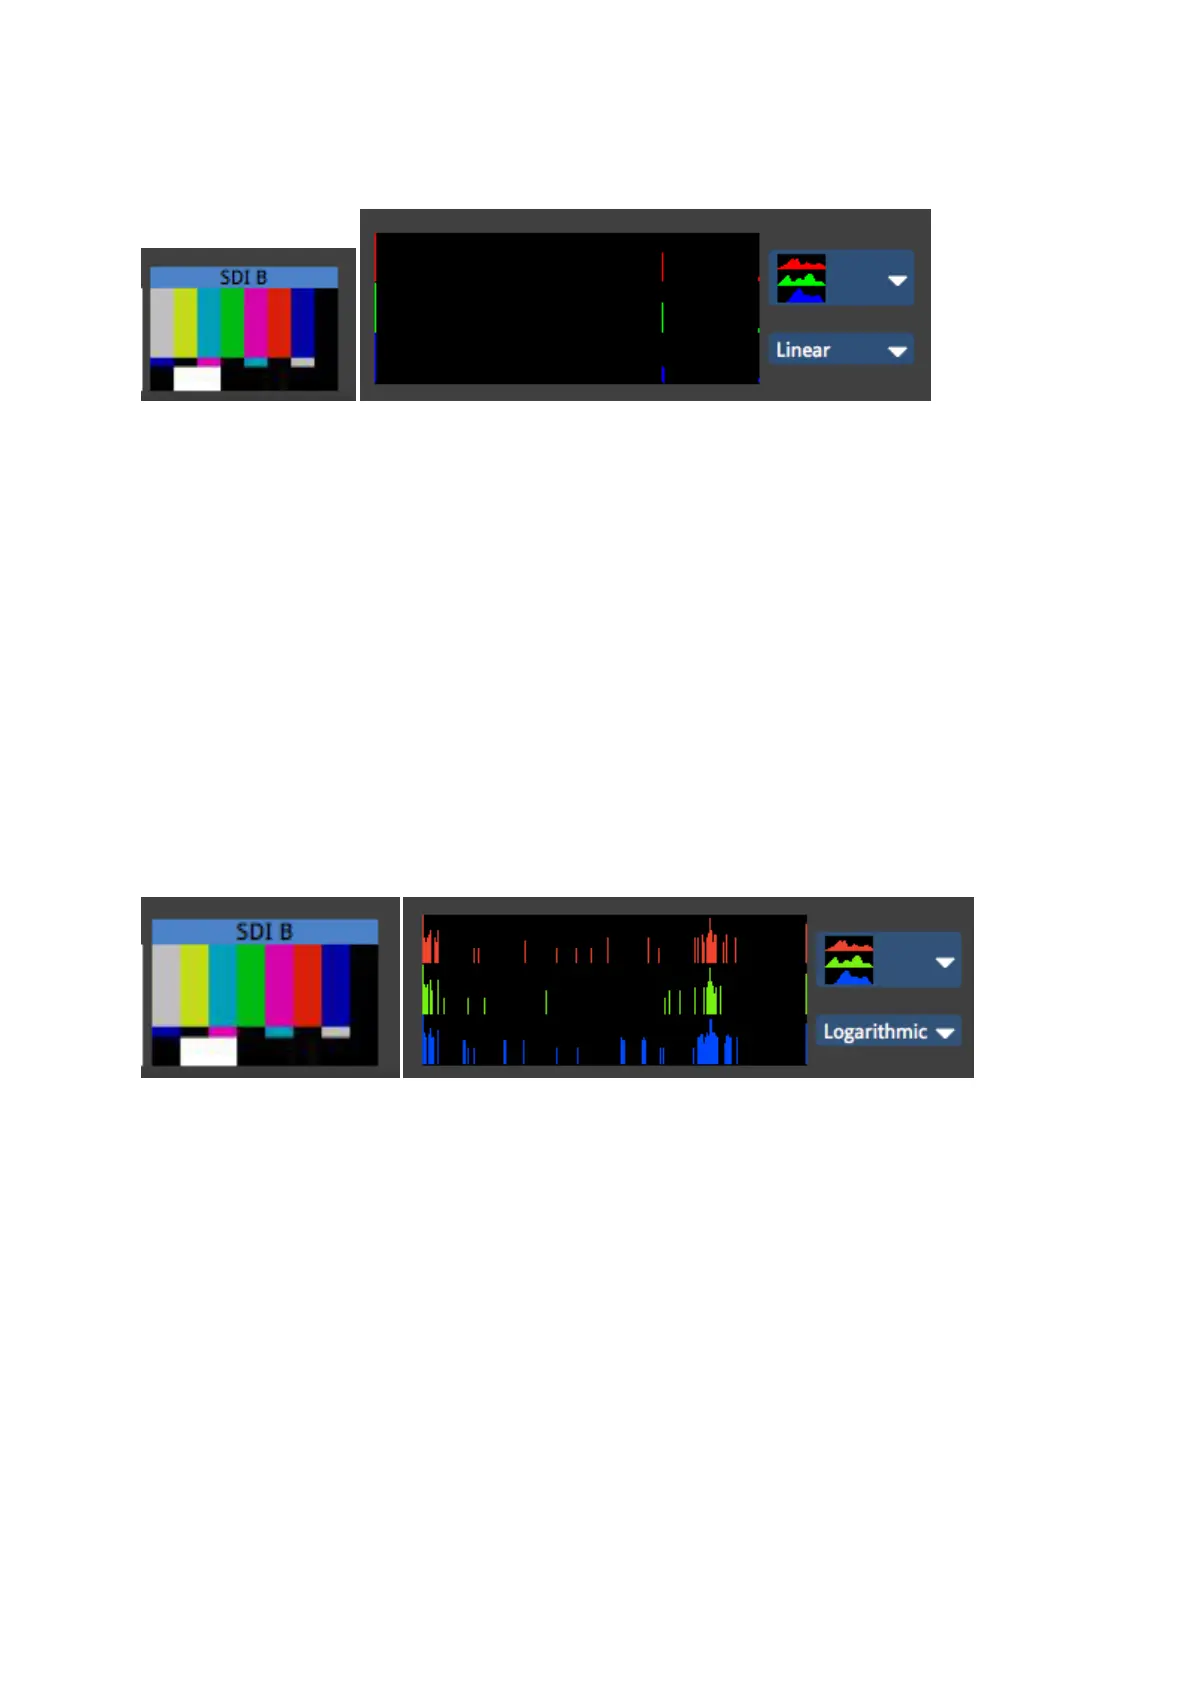
Figure 6-7. Test pattern showing colour bars at 75% and the corresponding Logarithmic RGB
histogram.
The above picture shows a logarithmic visualization of the input. Although the same three
areas 0%, 75% and 100% show the highest concentrations of columns there are now more
areas visible. So we can see that there are some small amounts of colour which deviate from
these three values and the image is not quite as perfectly composed of 75% colour as might
have been assumed from the linear scale.