• To select a different sensor press then press
Sensor Setup. Press the Change Sensor key opposite your
chosen measuring channel then use the left-hand arrow keys
to highlight a sensor and to select it. Press the left-hand
arrow key beside your chosen channel to enable it then
press twice to begin measuring.
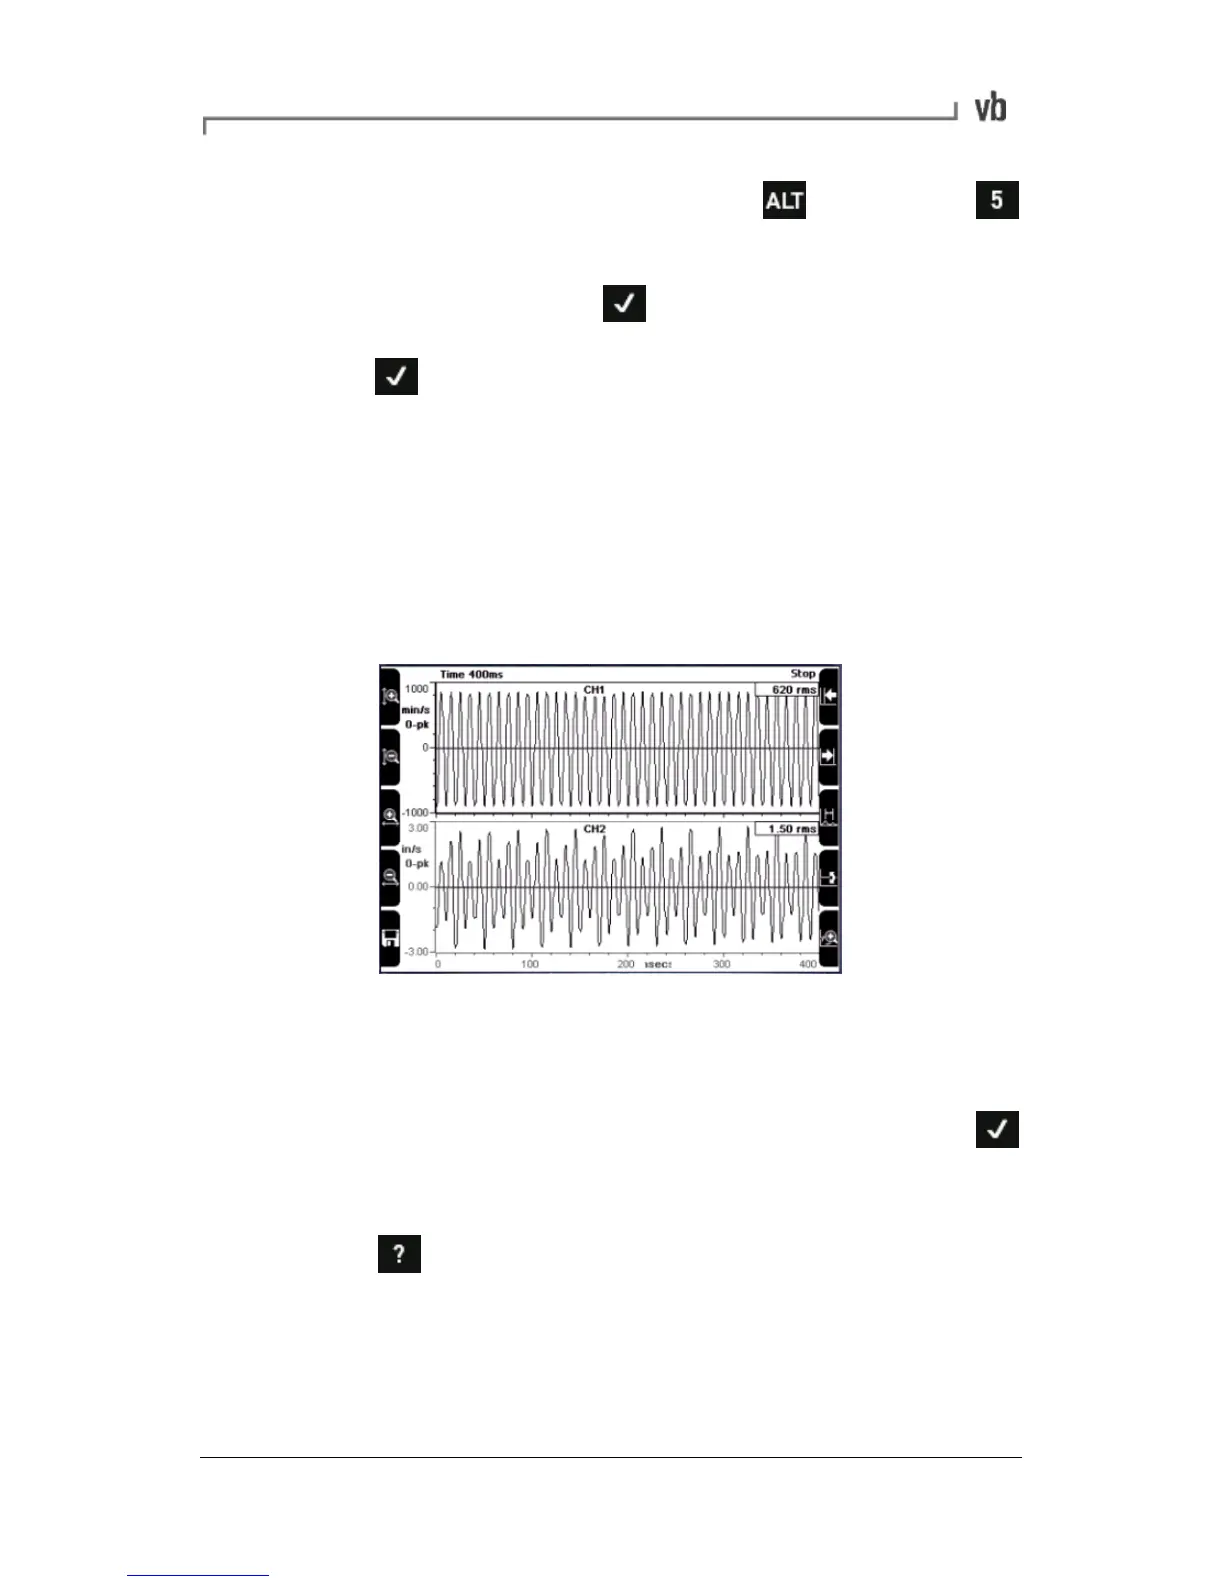
Working with Charts
You can display a separate on-screen chart for each measurement
channel. This allows you to watch multiple 'live' measurements at the
same time, freeze all measurements on-screen and compare them
together, and also toggle between the charts so that you can view
them one at a time.
Viewing two waveforms simultaneously
Analyzing Measurements
• To halt a measurement so that you can analyze it press
The overall vibration value will display at the top right of the
screen.
• Press to display hint labels for analysis options such as
zooming and displaying cursors.