D-Link DSR-Series User Manual 248
Section 10 - Status and Statistics
Status and Statistics
Path: Status > Dashboard
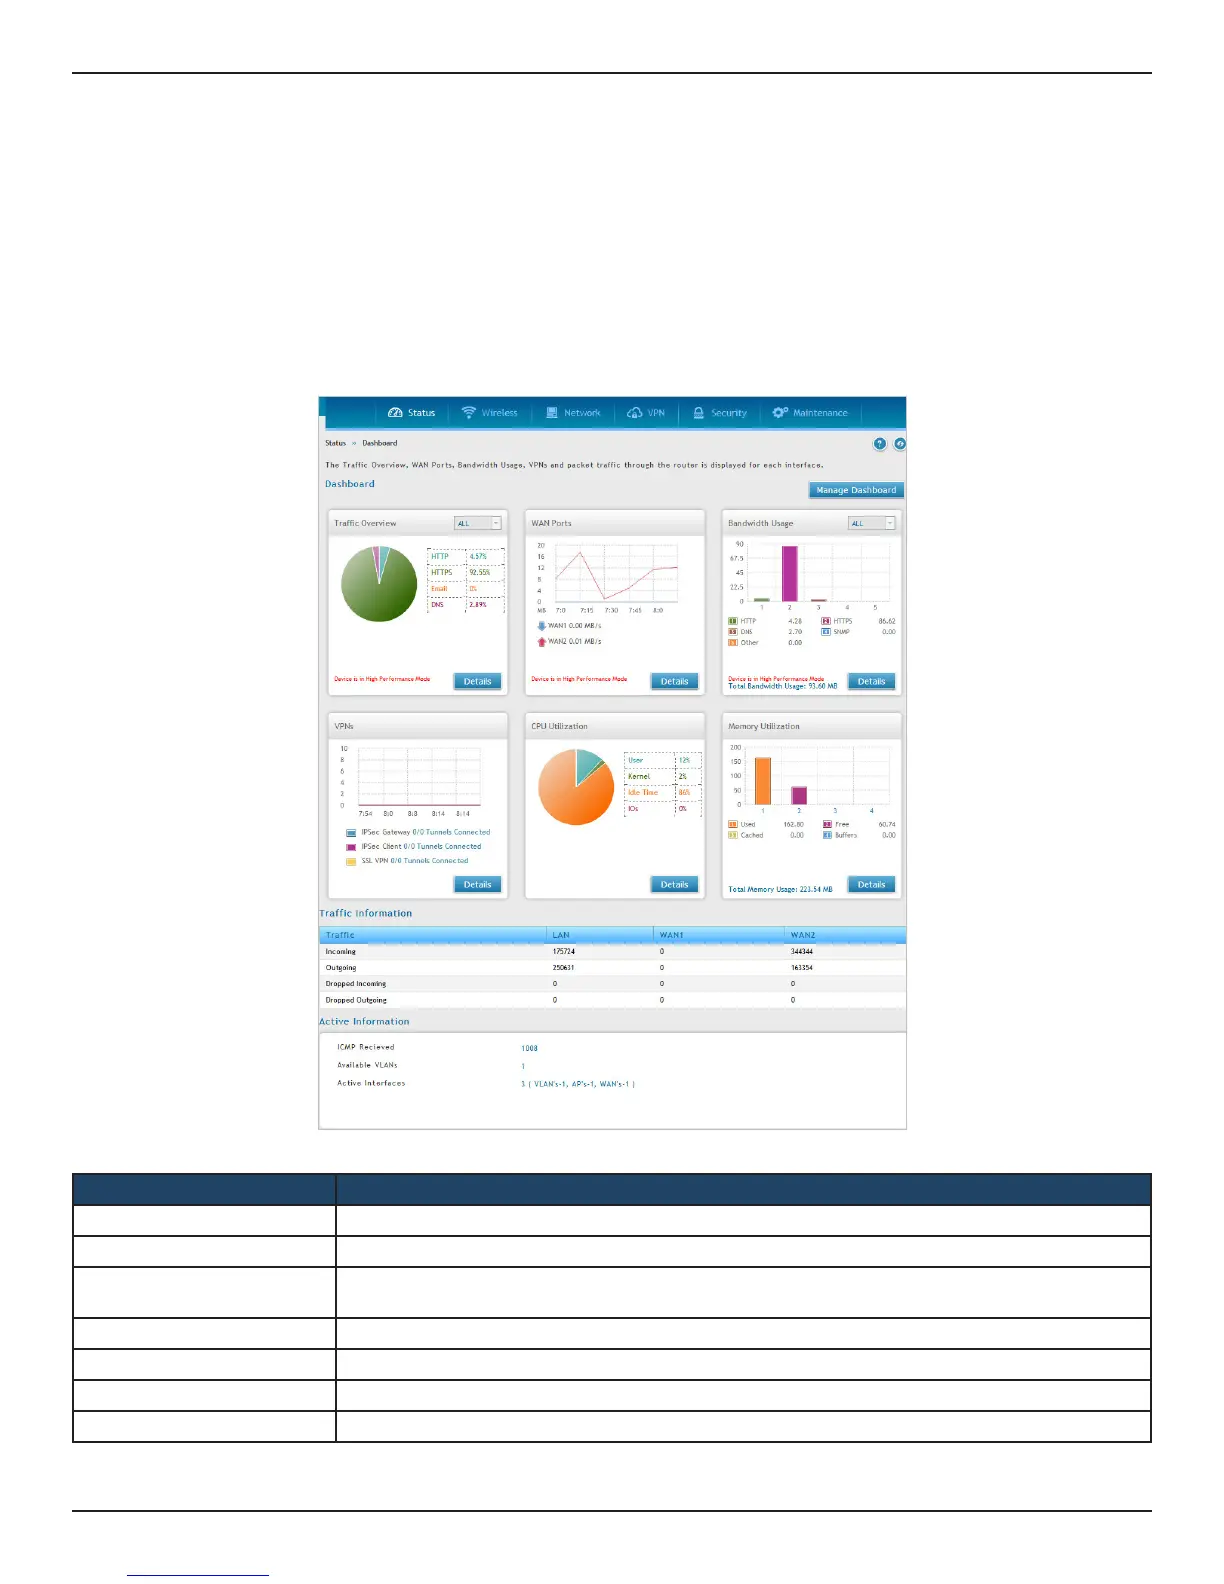
The router provides a dashboard that displays about the resources the system is using. The dashboard page is
organized into the following sections:
Field Description
Trac Overview It displays a chart of trac overview by service for each interface.
WAN Ports It displays a chart of trac overview by bandwidth and packet information for WAN trac.
Bandwidth Usage
It displays bandwidth usage by network segment such as WAN or LAN. The data is broken into by
applications service such as HTTP, HTTPS, DNS, SNMP, and others.
VPNs It displays a chart of VPN trac by bandwidth and number of tunnels.
CPU Utilization This section displays the router’s processor statistics.
Trac Information It displays the data transfer statistics for the LAN, Dedicated WAN1, WAN2 ports.
Active Information It displays the information of ICMP Received, Available VLANs, and Active Interfaces.
Dashboard
 Loading...