xStack® DES-3528/DES-3552 Series Layer 2 Managed Stackable Fast Ethernet Switch Web UI Reference Guide
329
Click the Clear button to clear all statistics counters on this window.
Click the View Table link to display the information in a table rather than a line graph.
Click the View Graphic link to display the information in a line graph rather than a table.
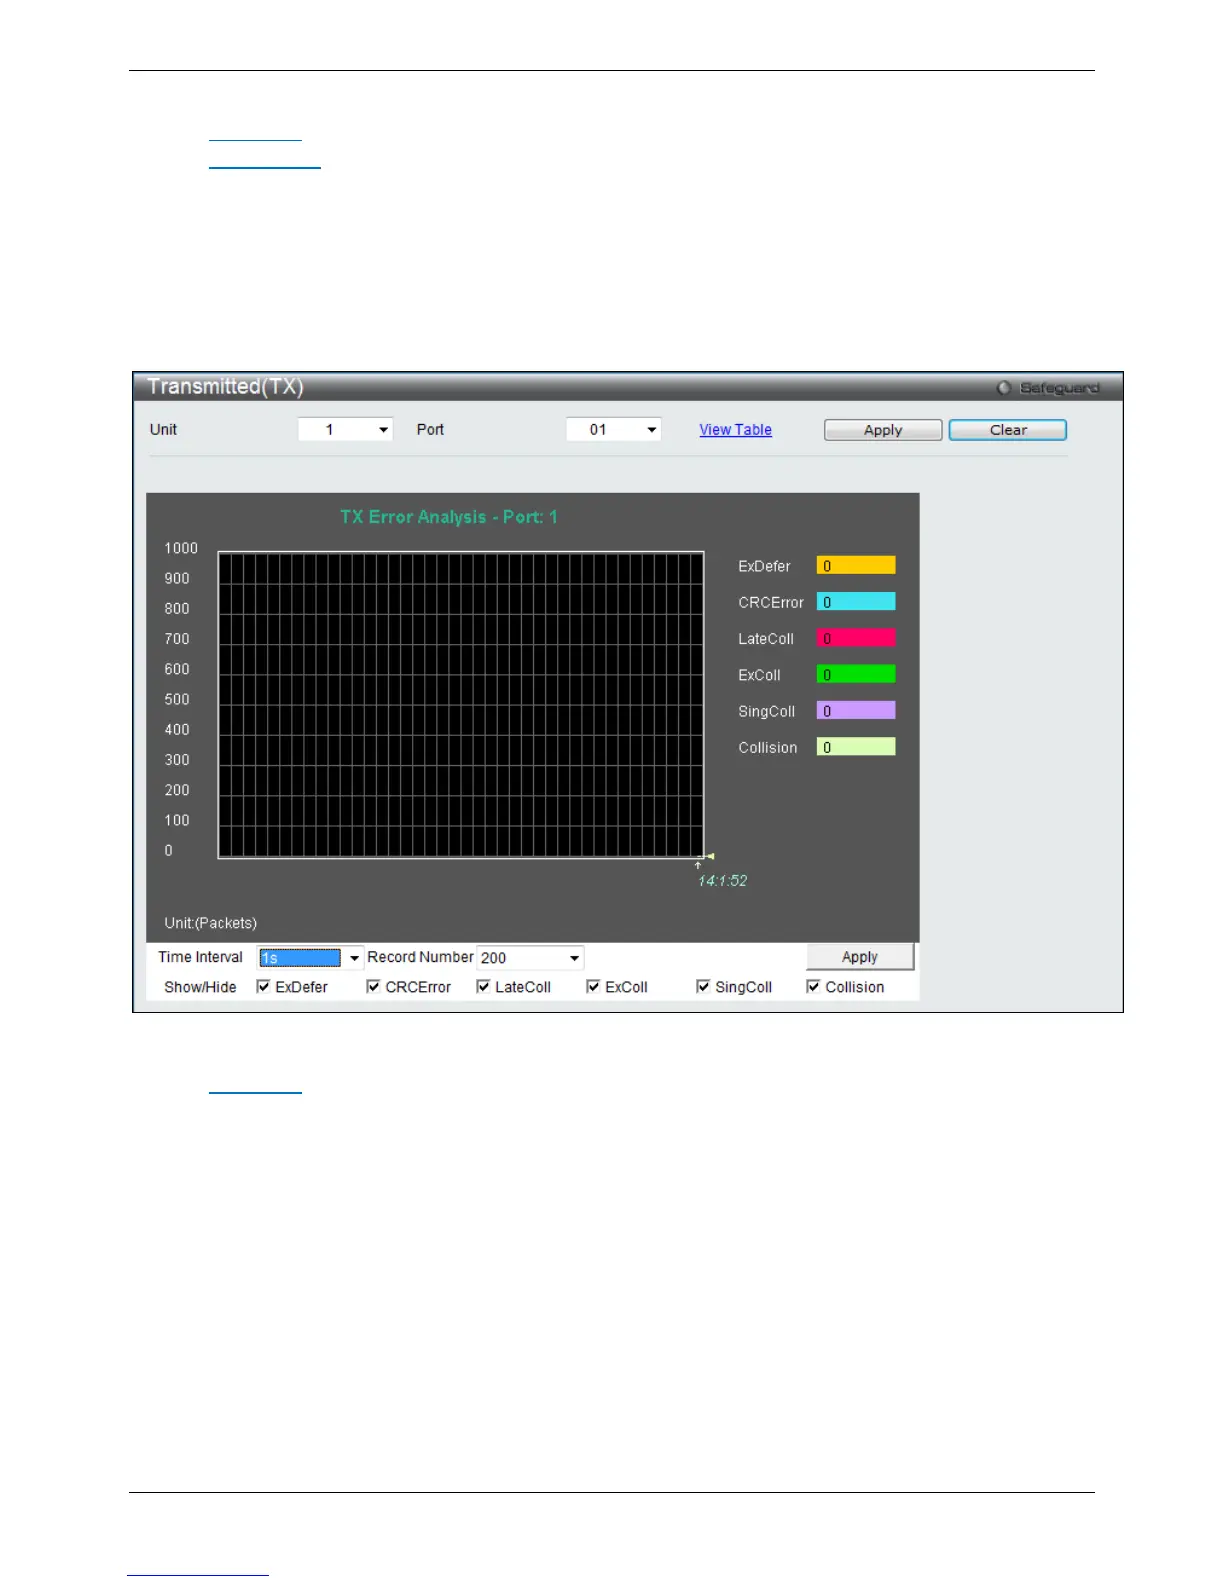
Transmitted (TX)
To select a port to view these statistics for, select the port by using the Port pull-down menu. The user may also
use the real-time graphic of the Switch at the top of the web page by simply clicking on a port.
To view this window, click Monitoring > Statistics > Port Statistics > Errors > Transmitted (TX), as shown
below:
Figure 11-12 Transmitted (TX) window (for errors)
Click the View Table link to display the information in a table rather than a line graph.
 Loading...