166 WaveRIDER
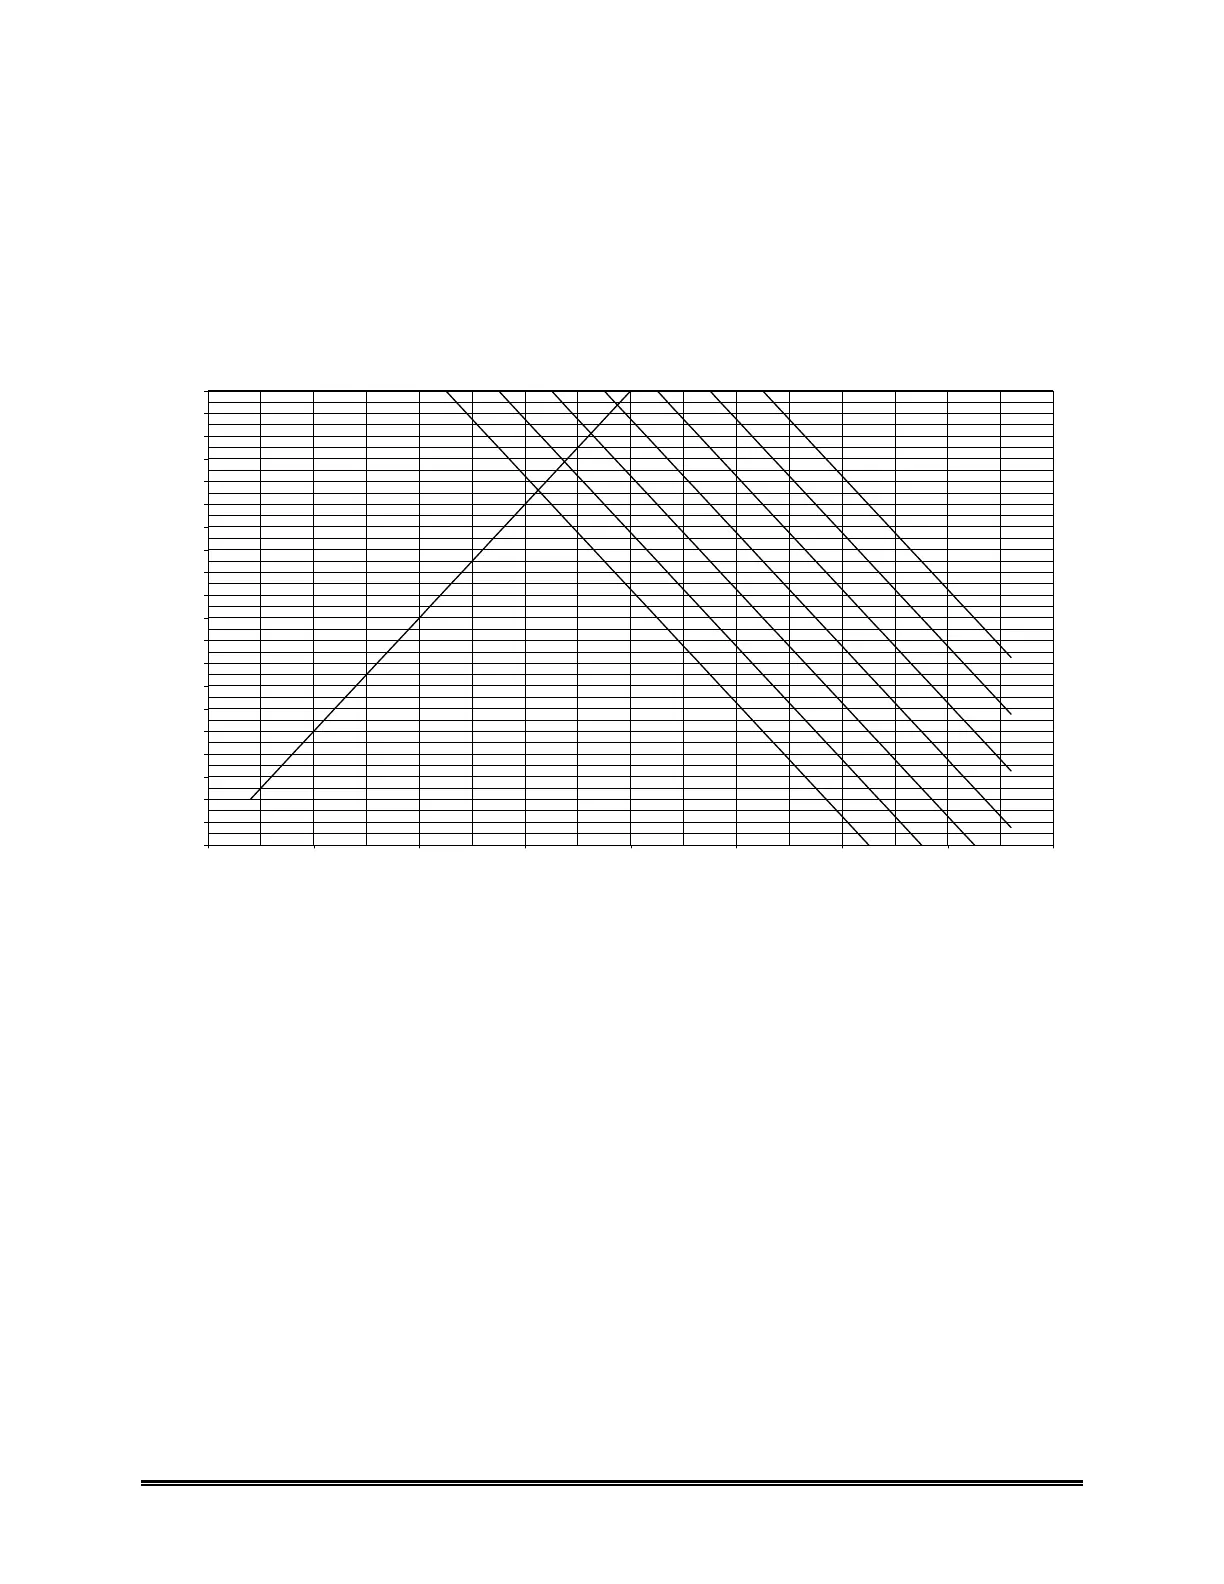
The graph shown in Figure C- 4 should be used to determine the maximum conveyor
speed you may use to avoid violating the 1.0 second minimum travel time between
sensors and waves. This is a function of the distance between the chip and solder
waves and the average solder wave contact length.
Maxium Conveyor Speed vs Contact Length
Dropout Filter time = 1.0 Sec
0
1
2
3
4
5
6
7
8
9
10
11
12
13
14
15
16
17
18
19
20
0.0 1.0 2.0 3.0 4.0 5.0 6.0 7.0 8.0
Wave Seperation (in)
Maximum Conveyor Speed (ft/min)
3.5" 3.0" 2.5" 2.0" 1.5" 1.0" 0.5"
Average Contact Length (in)
Figure C- 4: Dropout Time Graph
Locate the curve that represents your average contact length. Locate the Chip to Solder
wave separation on the X-axis of the graph. Move up vertically until it intersects the
contact length or the fixed curve. Look to the left to determine the maximum conveyor
speed you may run.
 Loading...