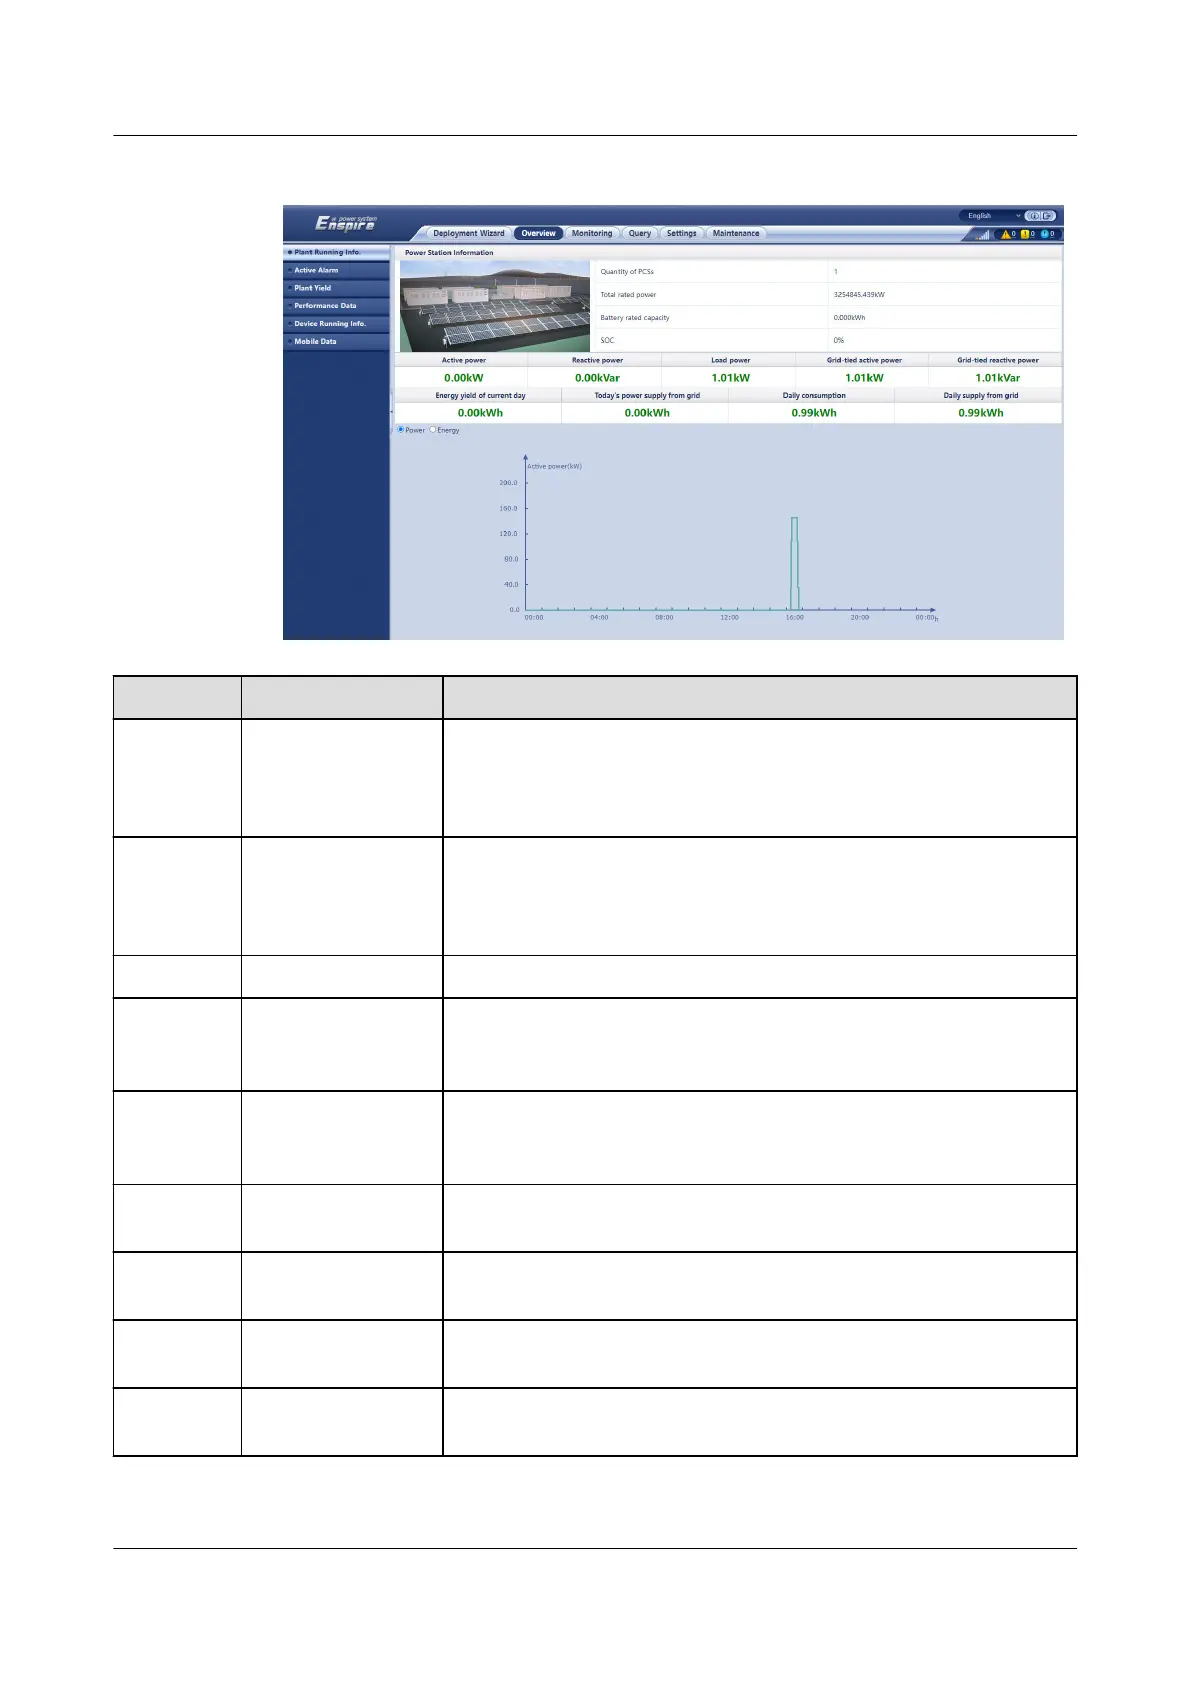
Figure 6-5 Plant Running Info.
No. Parameter Description
1 Active power Vector sum of the active power between the inverter and the
Smart PCS: Positive value indicates that energy is generated
through the inverter and negative value indicates that energy is
stored through the rectier.
2 Reactive power Vector sum of the reactive power between the inverter and the
Smart PCS: Positive value indicates that power is transmitted to
the grid and negative value indicates that power is transmitted
from the grid.
3 Load power Vector sum of the active power and grid-tied active power
4 Grid-tied active
power
Active power of the feed-in meter: Positive value indicates
purchasing electricity and negative value indicates selling
electricity.
5 Grid-tied reactive
power
Reactive power of the feed-in meter: Positive value indicates
that power is transmitted from the grid and negative value
indicates that power is transmitted to the power grid.
6 Energy yield of the
current day
Total energy yield of the inverter and Smart PCS on a day
7 Today's power
supply from grid
Total power supplied from the grid to the inverter and Smart
PCS on a day
8 Daily consumption Energy yield of the current day + Daily supply from grid – Daily
supply to grid – Today's power supply from grid
9 Daily supply from
grid
Current total positive active power of the feed-in meter – Total
positive active power at 00:00 on the current day
SmartLogger3000
User Manual 6 WebUI Operations
Issue 10 (2022-08-20) Copyright © Huawei Technologies Co., Ltd. 70