Chapter 3. Graphical user interface overview 81
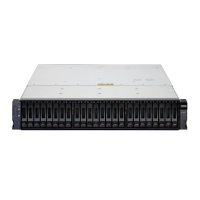
Figure 3-4 shows the dynamic menu.
Figure 3-4 Dynamic menu
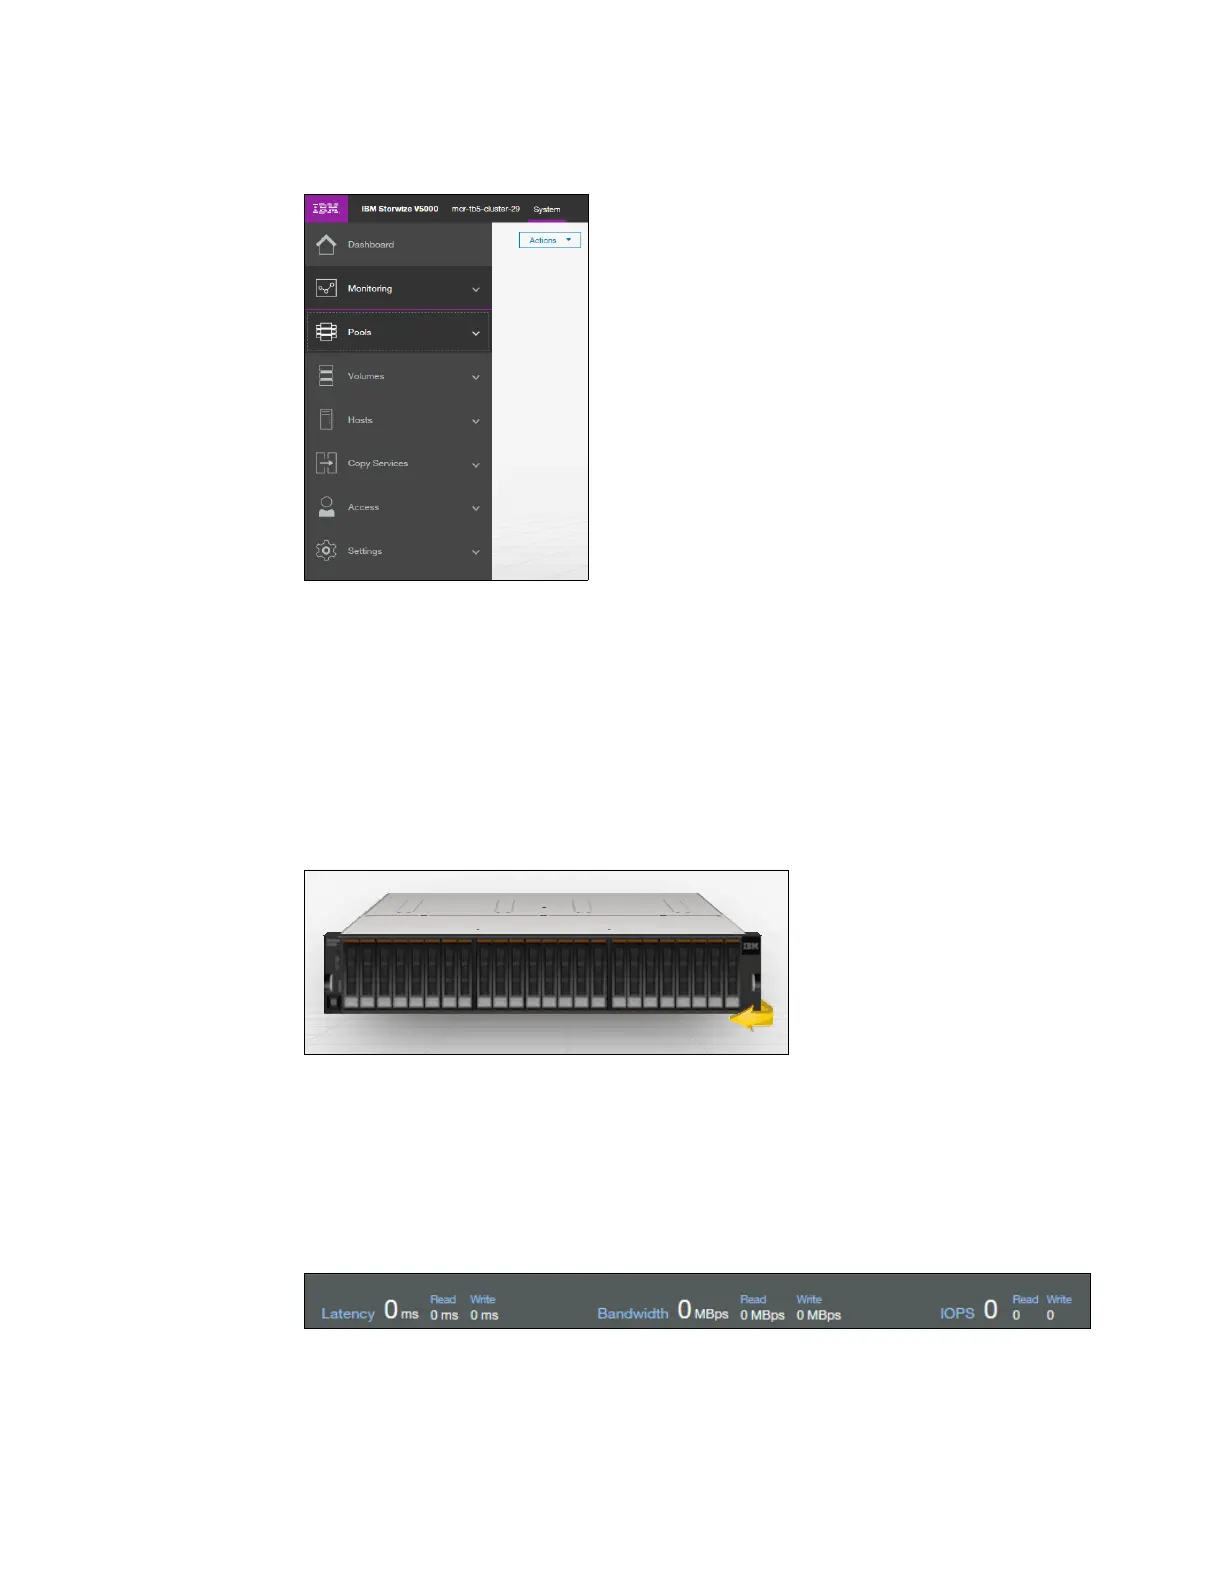
The middle of the window shows a component model of the existing configuration.
Hovering the mouse cursor over each component and its part highlights that part and
provides a pop-up menu with a description that identifies important parameters and
functions of this element. To see the rear of the component, you can dynamically rotate
them as in a typical 360° view. Right-clicking a component or its part opens its menu
showing actions, which are normally available from the dynamic menu on the left or from
the Actions Button in the upper left corner.
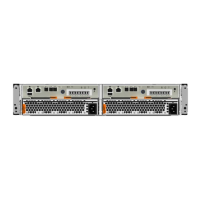
Figure 3-5 shows the component model.
Figure 3-5 Component model
The bottom of the window shows the performance indicator. It gives you information about
how your machine is performing right now. This information covers only the external tasks
for attached hosts. Figure 3-6 shows the performance indicator.
To see information about how the performance internally is, view the System statistic
page, as shown in Figure 3-7 on page 82.
Figure 3-6 Performance indicator
 Loading...