USER MANUAL
INTEL® FALCON™ 8+ UAS
© 2018 Intel Corporation. All rights reserved 180
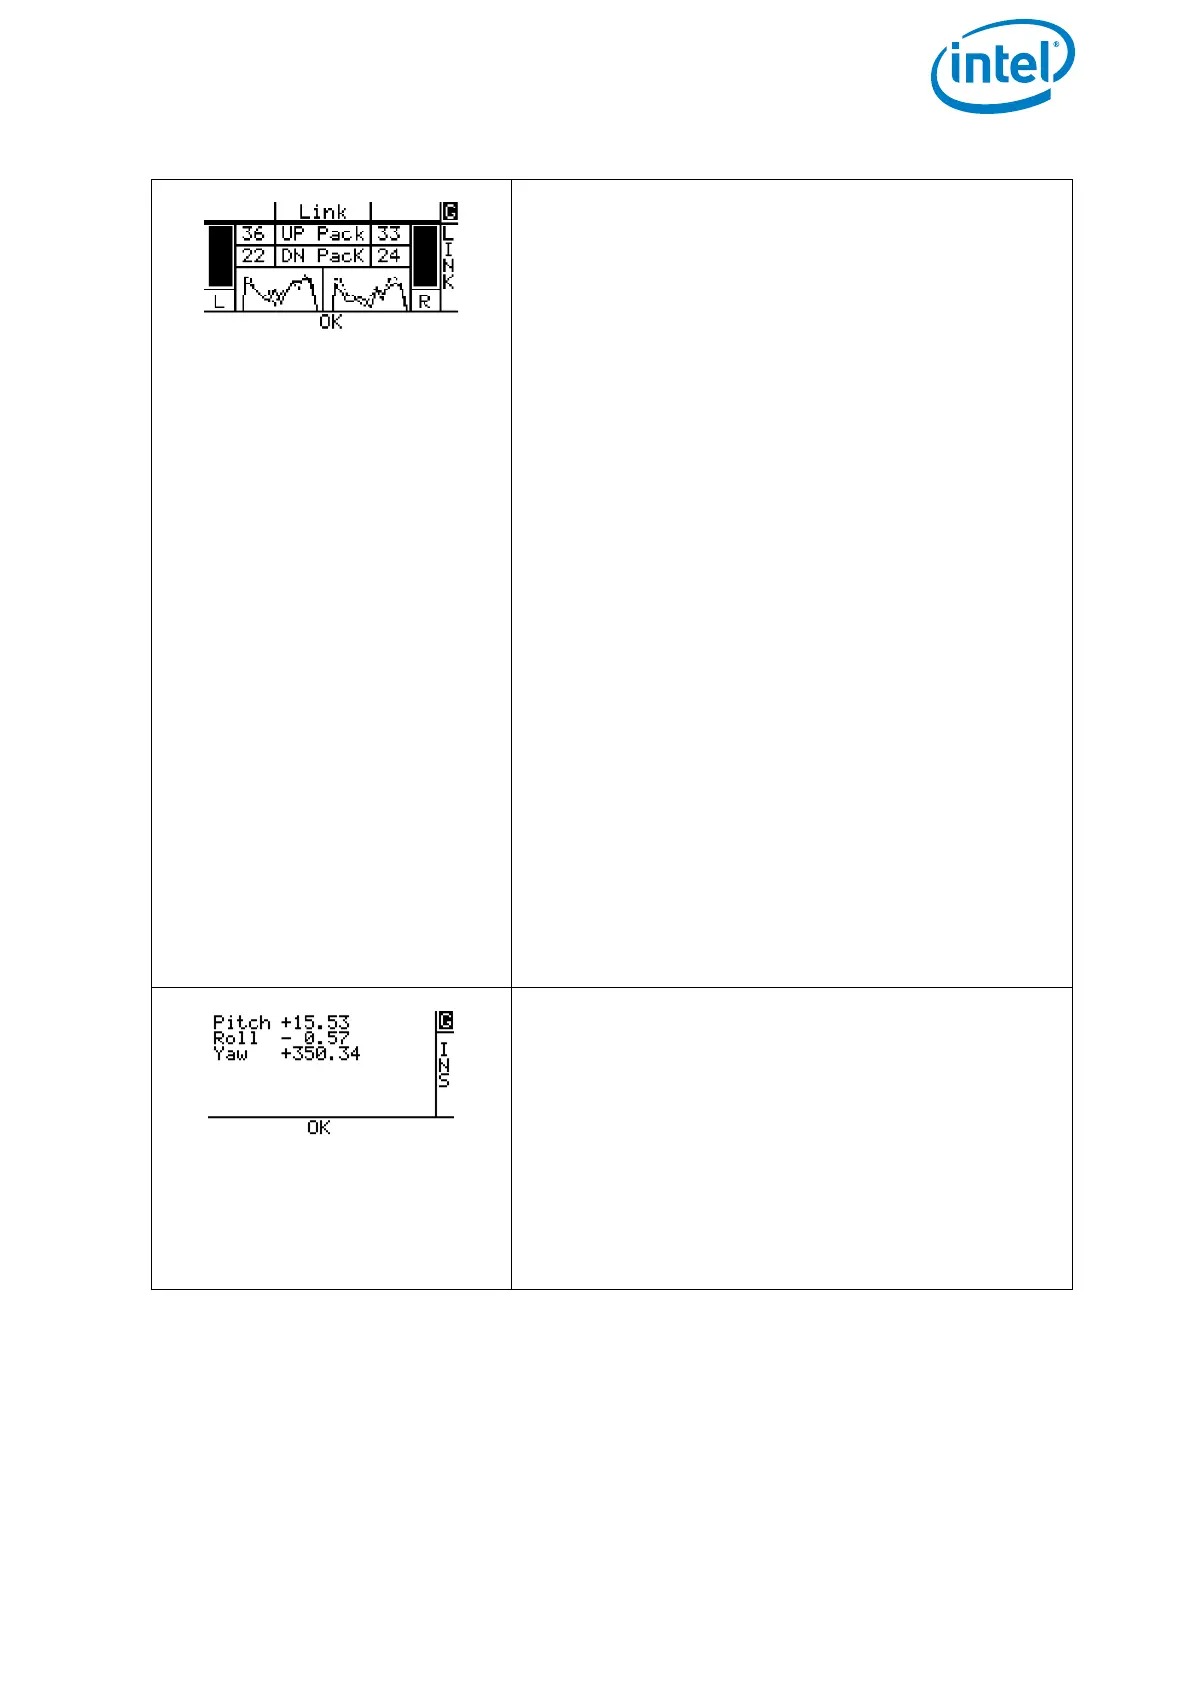
Data Link Screen
Displays the quality of both data links of the sys-
tem. Helpful to analyze the situation if there are
Link Weak! warnings.
G = Flight Mode. This is the same information as
on the Main Screen.
Left (L) and right (R) bars = Signal strength of left
and right data link (derived from the number of
transmitted data packages).
Left graph
• solid line = signal to noise ratio (SNR) on
the left data link of the CTR
• dotted line = SNR on the right data link of
the CTR
Right graph
• solid line = SNR on the left data link of the
Intel® Falcon™ 8+ UAV
• dotted line = SNR on the right data link of
the Intel® Falcon™ 8+ UAV
UP Pack = Uploaded data packages per second
from the CTR to the flight system.
DN Pack = Downloaded data packages per sec-
ond from the flight system to the CTR.
OK = Status line. This is the same information as
on the Main Screen.
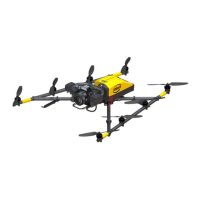
Attitude Angles Screen
Displays pitch, roll and yaw angles of the UAV.
Pitch = Pitch angle of the UAV.
G = Flight Mode. This is the same information as
on the Main Screen.
Roll = Roll angle of the UAV.
Yaw = Heading direction of the UAV
OK = Status line. This is the same information as
on the Main Screen.
Figure 4.2: Main Information Screens (Continued)