ManagerIQEasy_UM_9752103002_GB_V3_1 38
6.11.2 Tab “Graphics”
The “Graphics” screen graphically displays the operation of the Device. The graph shows
important measured values in relation to time, in the case of a Sensor, the current measured
values. In the key it is made clear what the representation of each coloured line is.
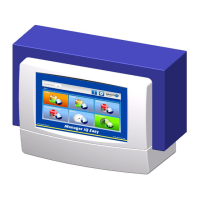
Press (Graphics) to display the graphical display. For a Sensor IQ Easy the screen
looks like this:
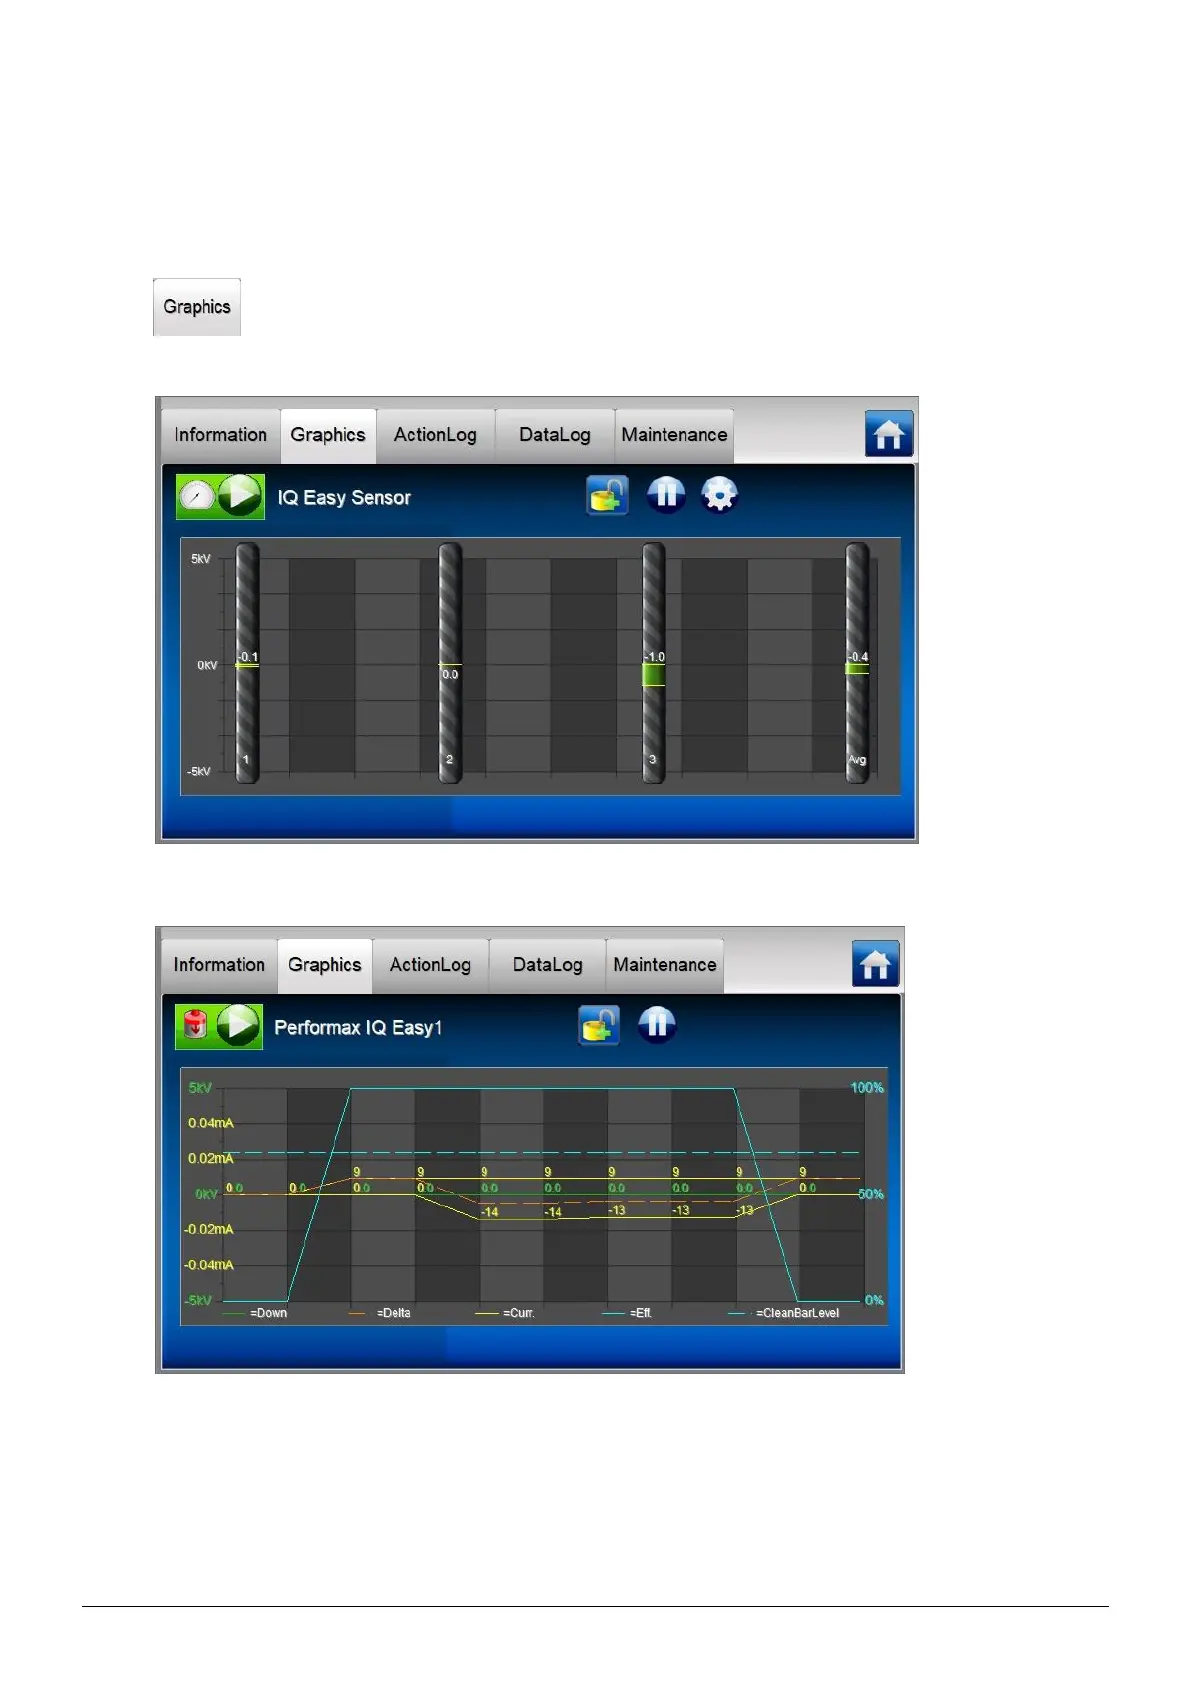
For a Performax IQ Easy the screen looks like this (note: the display will differ per Device).
The current display can be ‘frozen’ or stopped by pressing anywhere on the graph field. The text
“On hold” then appears on the screen. By pressing the graph field again, the text “On Hold” will
disappear and the current values will be displayed again.
The speed at which the graphical screen is updated is set using the Device parameter “Graphic
refresh time”. By default, this is set to 1 second. See Section 6.12 on how the parameter can
be changed.
 Loading...