X-Stream Operator’s Manual
WM-OM-E Rev I 123
Here is a monochrome (analog) view of the same
waveform. The lightest areas indicate highest
intensity, corresponding to the red areas in the
solid view.
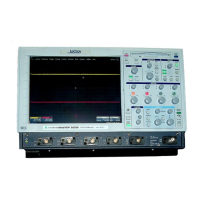
Here is a shaded (projected light) view of the same
waveform. This view emphasizes the shape of the
pulses.
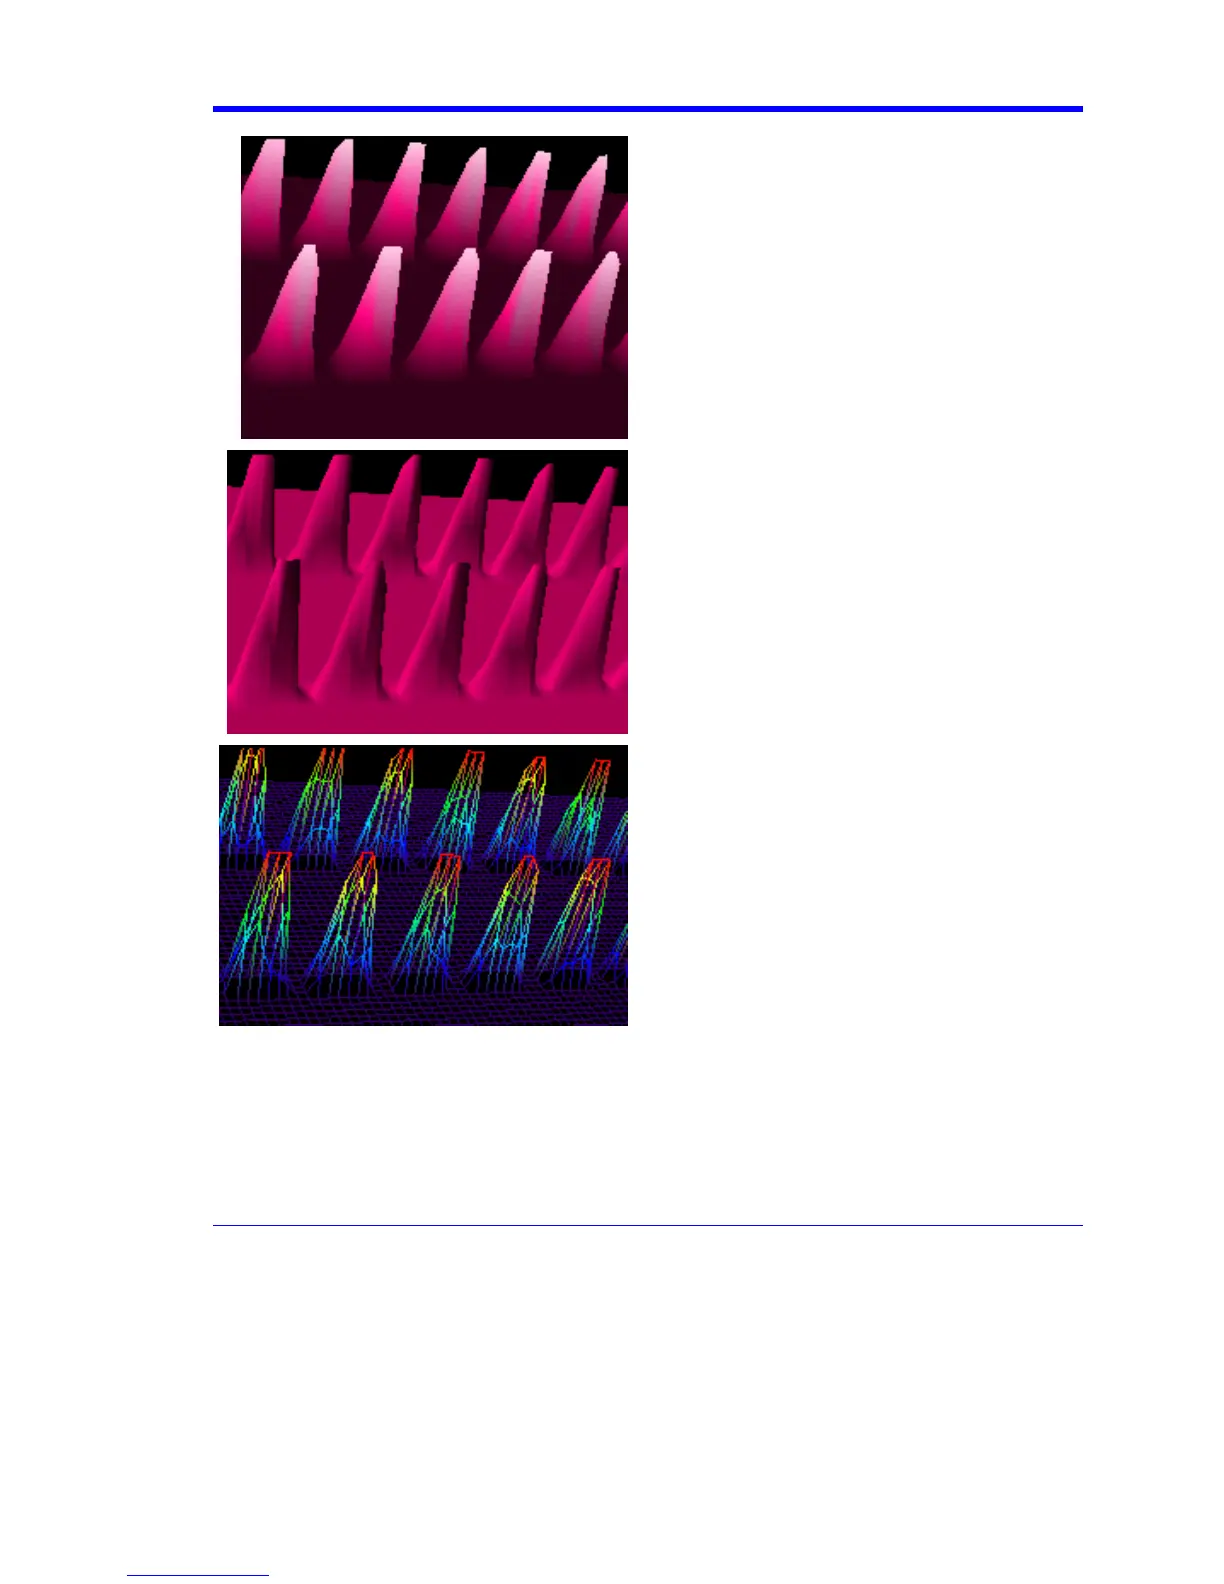
Here is a wire frame view of the same waveform in
which lines of equal intensity are used to construct
the persistence map.
Show Last Trace
For most applications, you may not want to show the last trace because it will be superimposed on
top of your persistence display. In those cases turn off Show Last Trace by touching the checkbox.
However, if you are doing mask testing and want to see where the last trace is falling, turn Show
Last Trace on.