158 WM-OM-E Rev I
xapk X Coordinate of xx
th
Peak
Definition:
Returns the value of the xx
th
peak that is the largest by area in a histogram.
Description:
First the peaks in a histogram are determined and ranked in order of total area
(for a discussion on how peaks are identified see the description for the pks
parameter). The center of the n
th
ranked peak (the point where the area to the left
is equal to the area to the right), where n is selected by you, is then returned as
xapk.
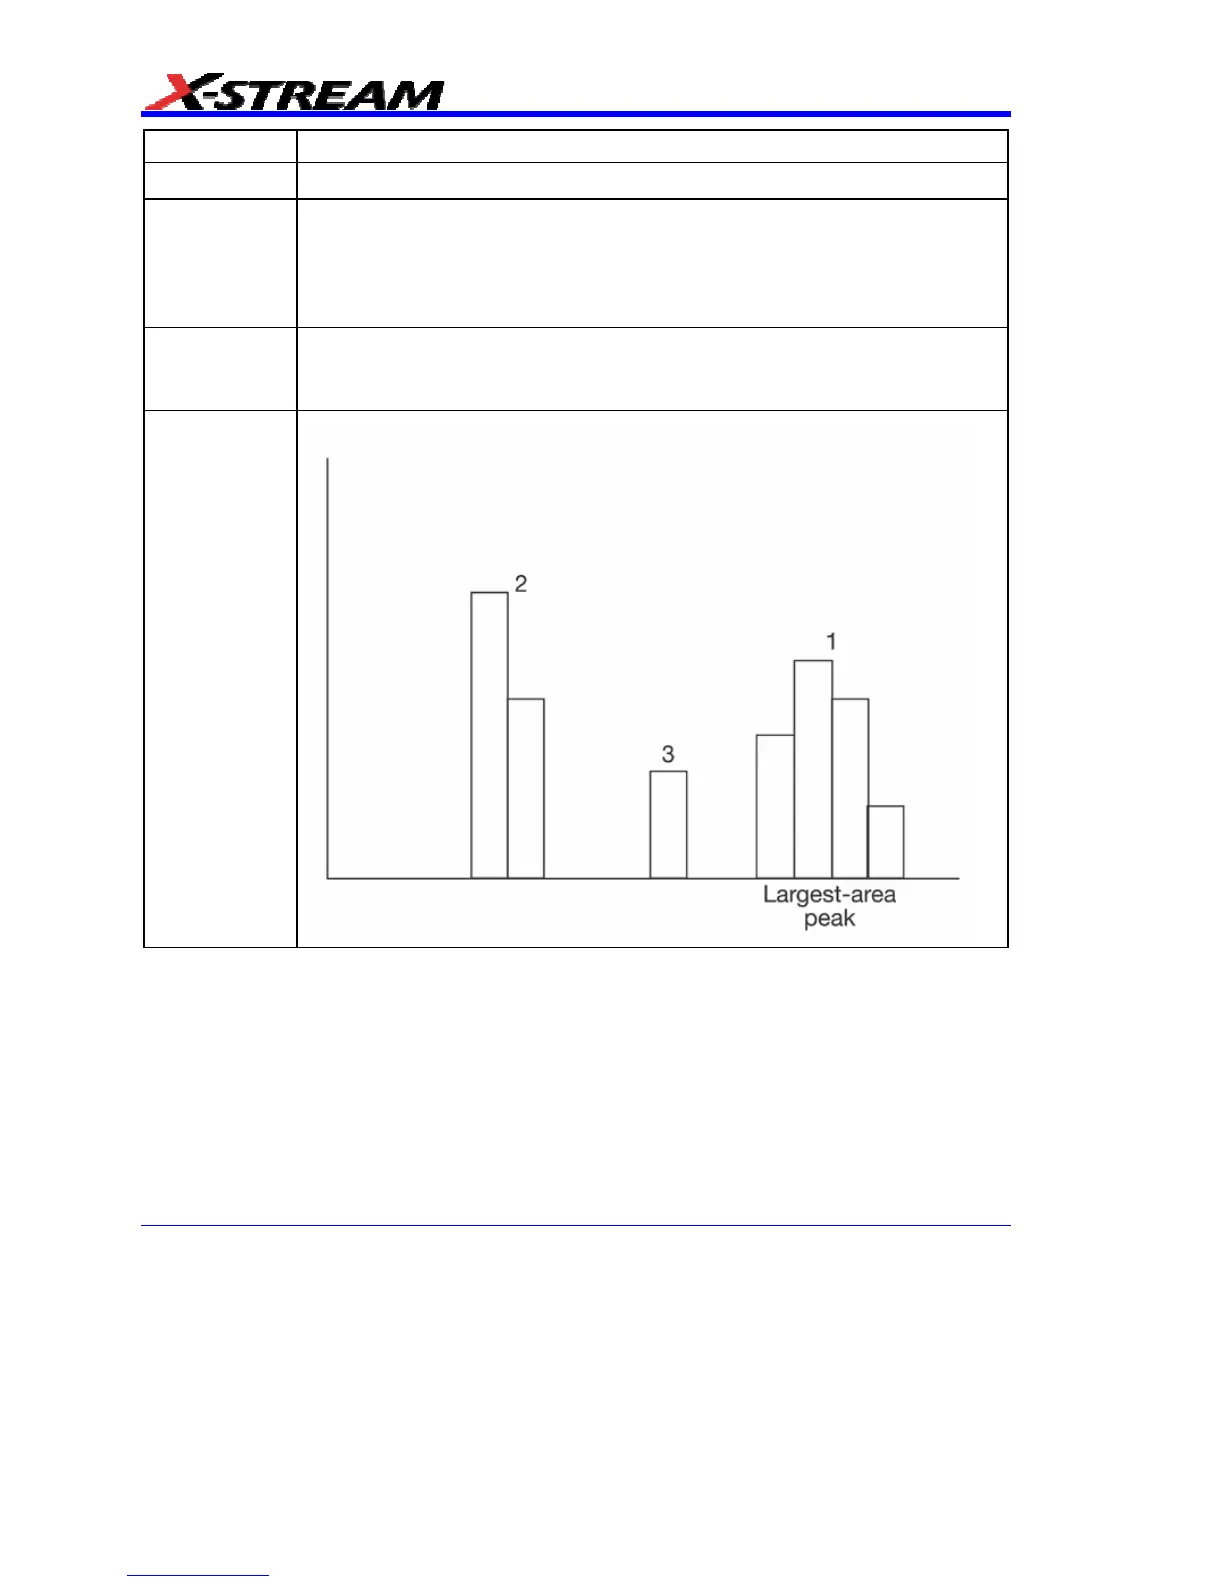
Example:
The rightmost peak is the largest, and is thus ranked first in area (1). The leftmost
peak, although higher, is ranked second in area (2). The lowest peak is also the
smallest in area (3).
Histogram Theory of Operation
An understanding of statistical variations in parameter values is needed for many waveform
parameter measurements. Knowledge of the average, minimum, maximum, and standard
deviation of the parameter may often be enough, but in many cases you may need a more detailed
understanding of the distribution of a parameter's values.
Histograms allow you to see how a parameter's values are distributed over many measurements.
They do this by dividing a range of parameter values into sub-ranges called bins. A count of the
number of parameter values (events) that fall within ranges of the bin itself is maintained for each
bin.