162 WM-OM-E Rev I
percentile data value in histogram for which specified `x'% of population is smaller
peaks number of peaks in histogram
pop @ x population of bin for specified horizontal coordinate
range difference between highest and lowest data values
total pop total population in histogram
x at peak x-axis position of specified largest peak
Histogram Peaks
Because the shape of histogram distributions is particularly interesting, additional parameter
measurements are available for analyzing these distributions. They are generally centered around
one of several peak value bins, known, with its associated bins, as a histogram peak.
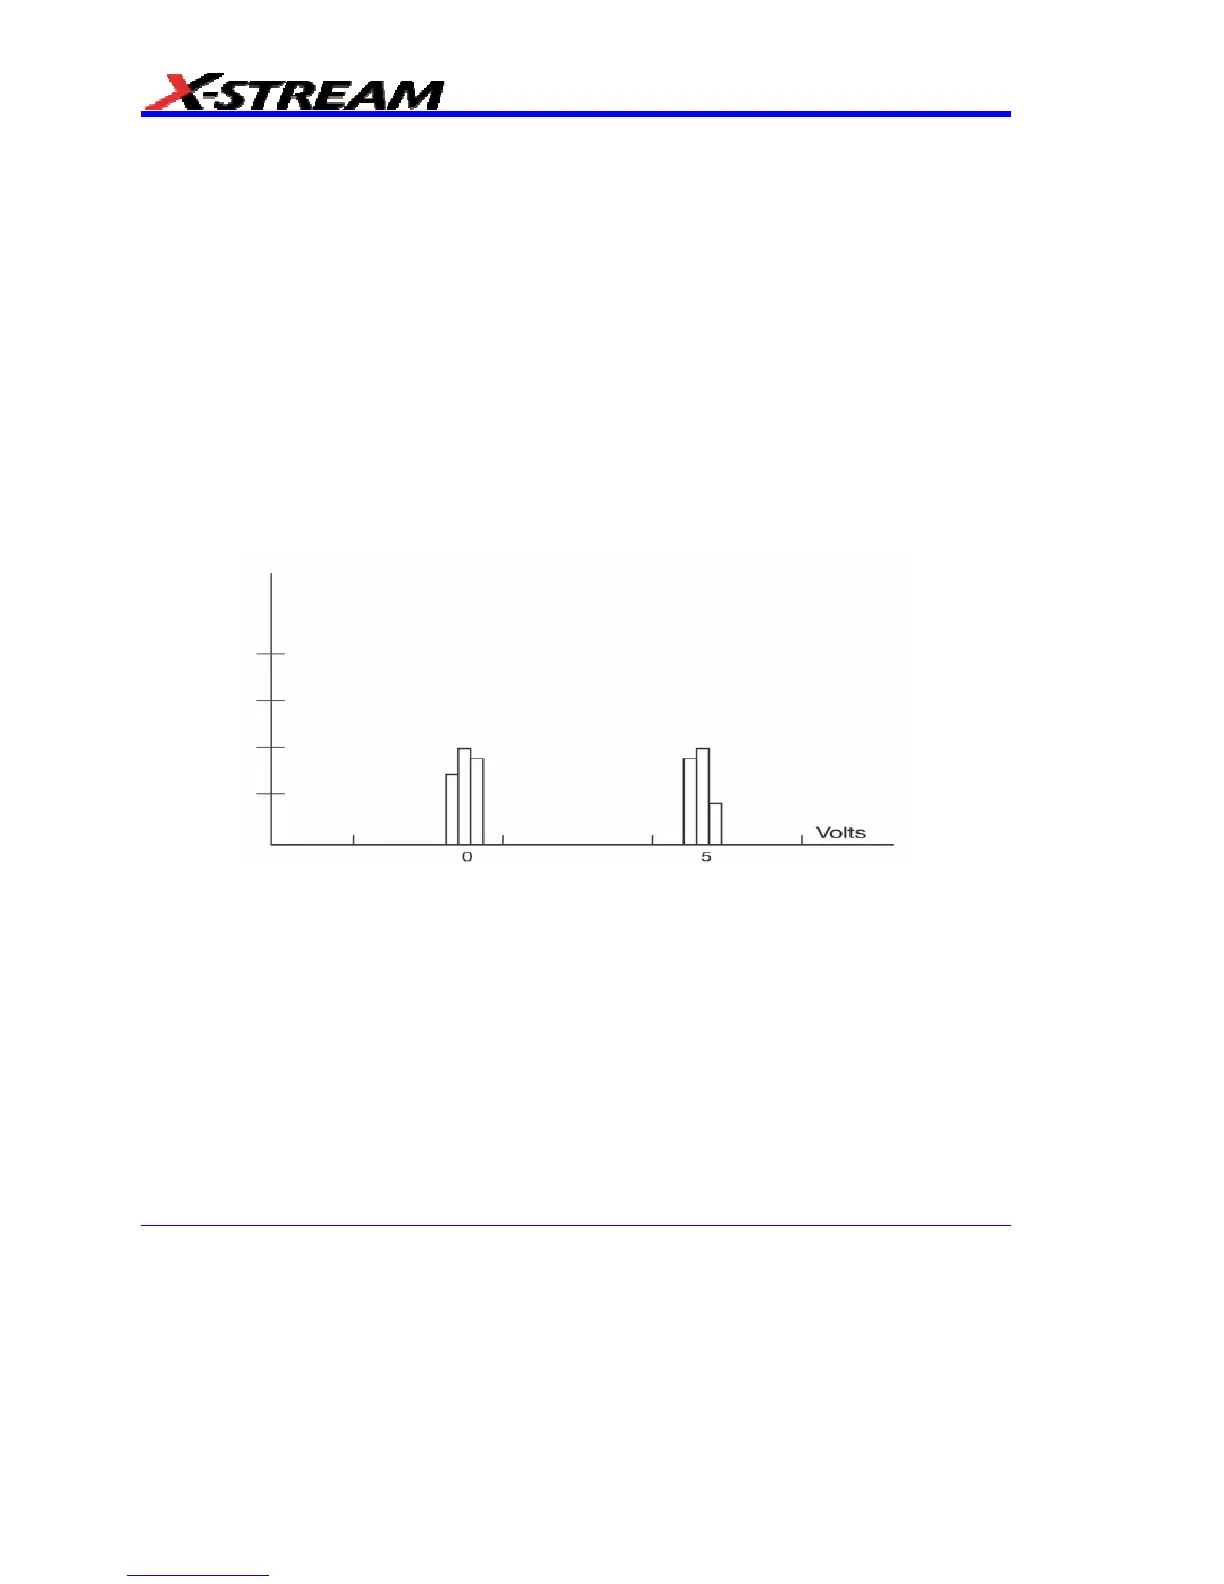
Example: In the following figure, a histogram of the voltage value of a five-volt amplitude square
wave is centered around two peak value bins: 0 V and 5 V. The adjacent bins signify variation due
to noise. The graph of the centered bins shows both as peaks.