EasyManuals Logo

LeCroy WaveMaster 8600A User Manual

LeCroy WaveMaster 8600A
437 pages
To Next Page IconTo Next Page
To Previous Page IconTo Previous Page
Page #336 background imageLoading...
Page #336 background image
334 WM-OM-E Rev I
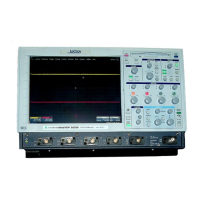
Second Example PlugIn - Log-Log FFT Plot
A frequent requirement is to plot a frequency spectrum on two logarithmic scales. The instrument
provides a vertical scale, so CustomDSO has only to change the horizontal one. Here is an
example. The first figure has been truncated on the right side.
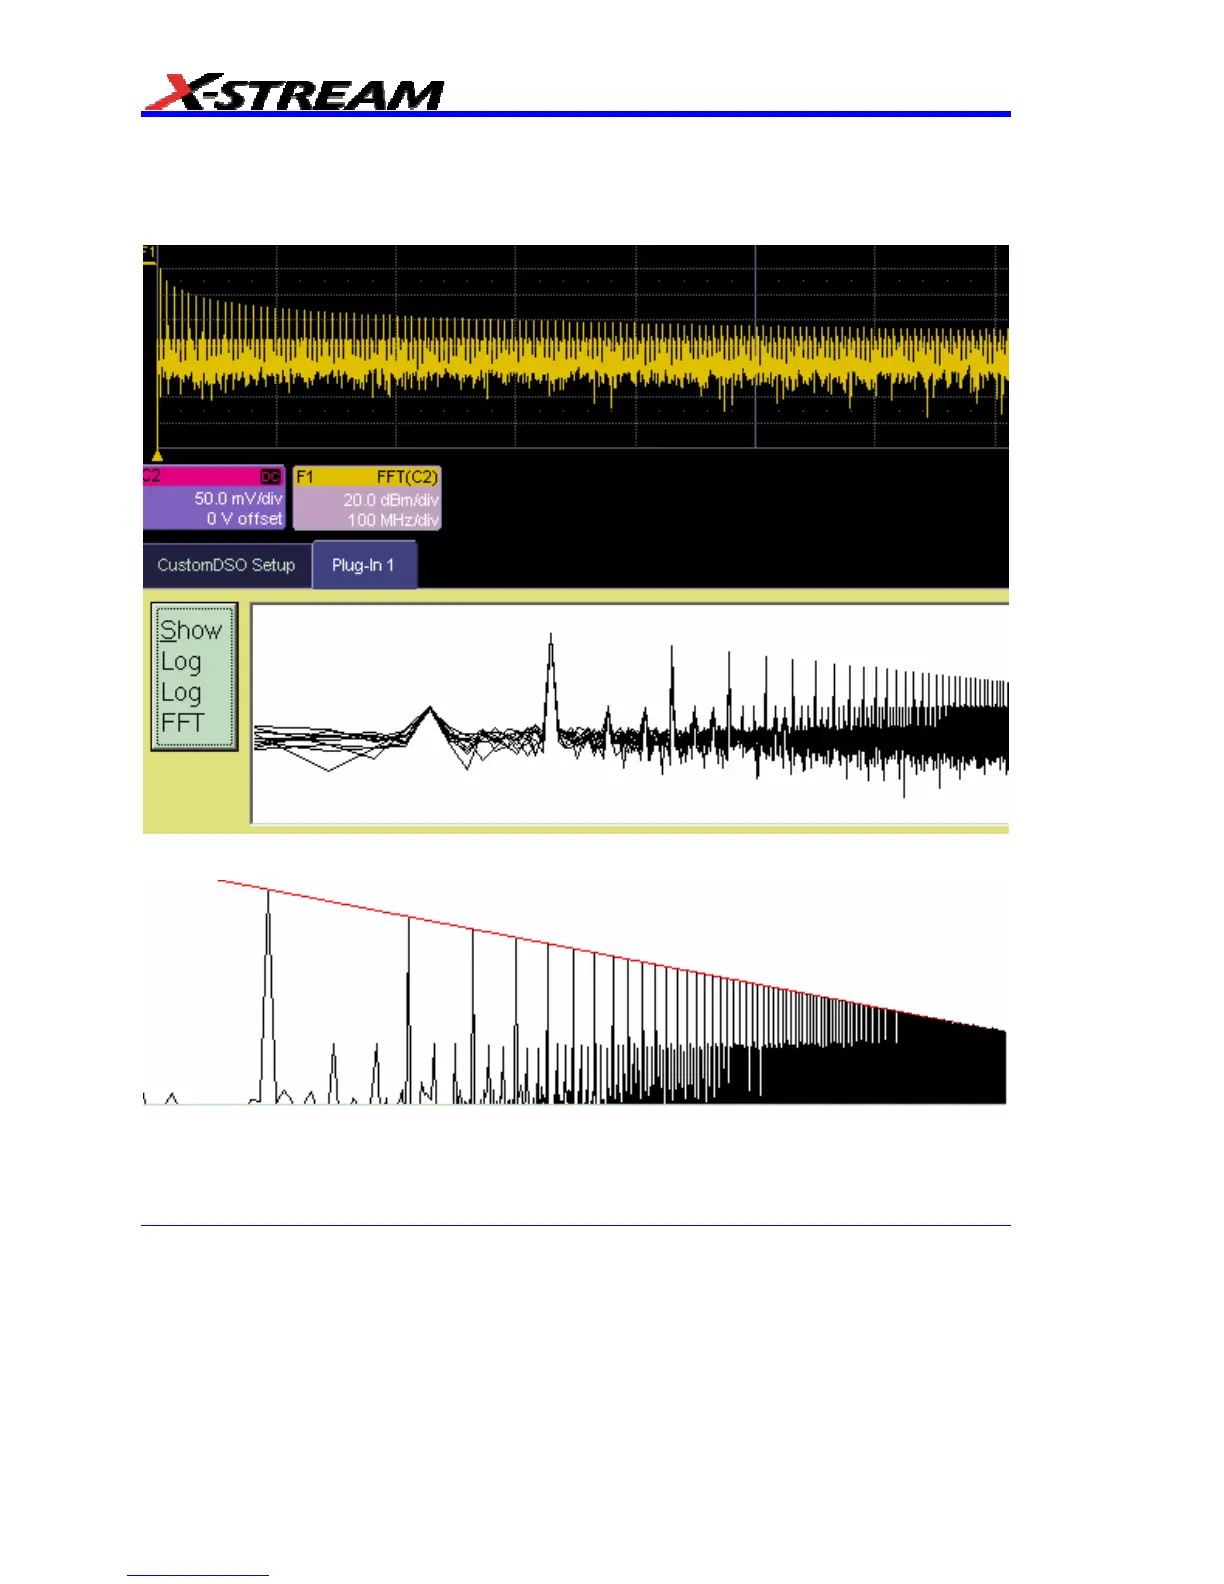
These examples were made with two different instrument setups: in the second, the FFT was
zoomed vertically. The graph has a red line to represent the theoretical envelope for the peaks.
This has great potential for testing the transmission characteristics of amplifiers and filters, since
the output can be compared with a theoretical curve. Furthermore, if the output is divided by the

Table of Contents

Questions and Answers:

Question and Answer IconNeed help?

Do you have a question about the LeCroy WaveMaster 8600A and is the answer not in the manual?

LeCroy WaveMaster 8600A Specifications

General IconGeneral
Bandwidth6 GHz
Sample Rate20 GS/s
Channels4
Vertical Resolution8 bits
Input CouplingAC, DC, GND
Input Impedance50 Ω, 1 MΩ
Input Voltage Range±1 V (50 Ω), ±5 V (1 MΩ)
Trigger ModesEdge, Pattern, Video
Display10.4 inch Color LCD
InterfaceUSB, Ethernet, GPIB
Operating Temperature0 to 50 °C
Weight40 lbs (18.2 kg)

Related product manuals