272 WM-OM-E Rev I
.
5. Retrigger the scope (if it is not currently triggering)
6. Return to the program
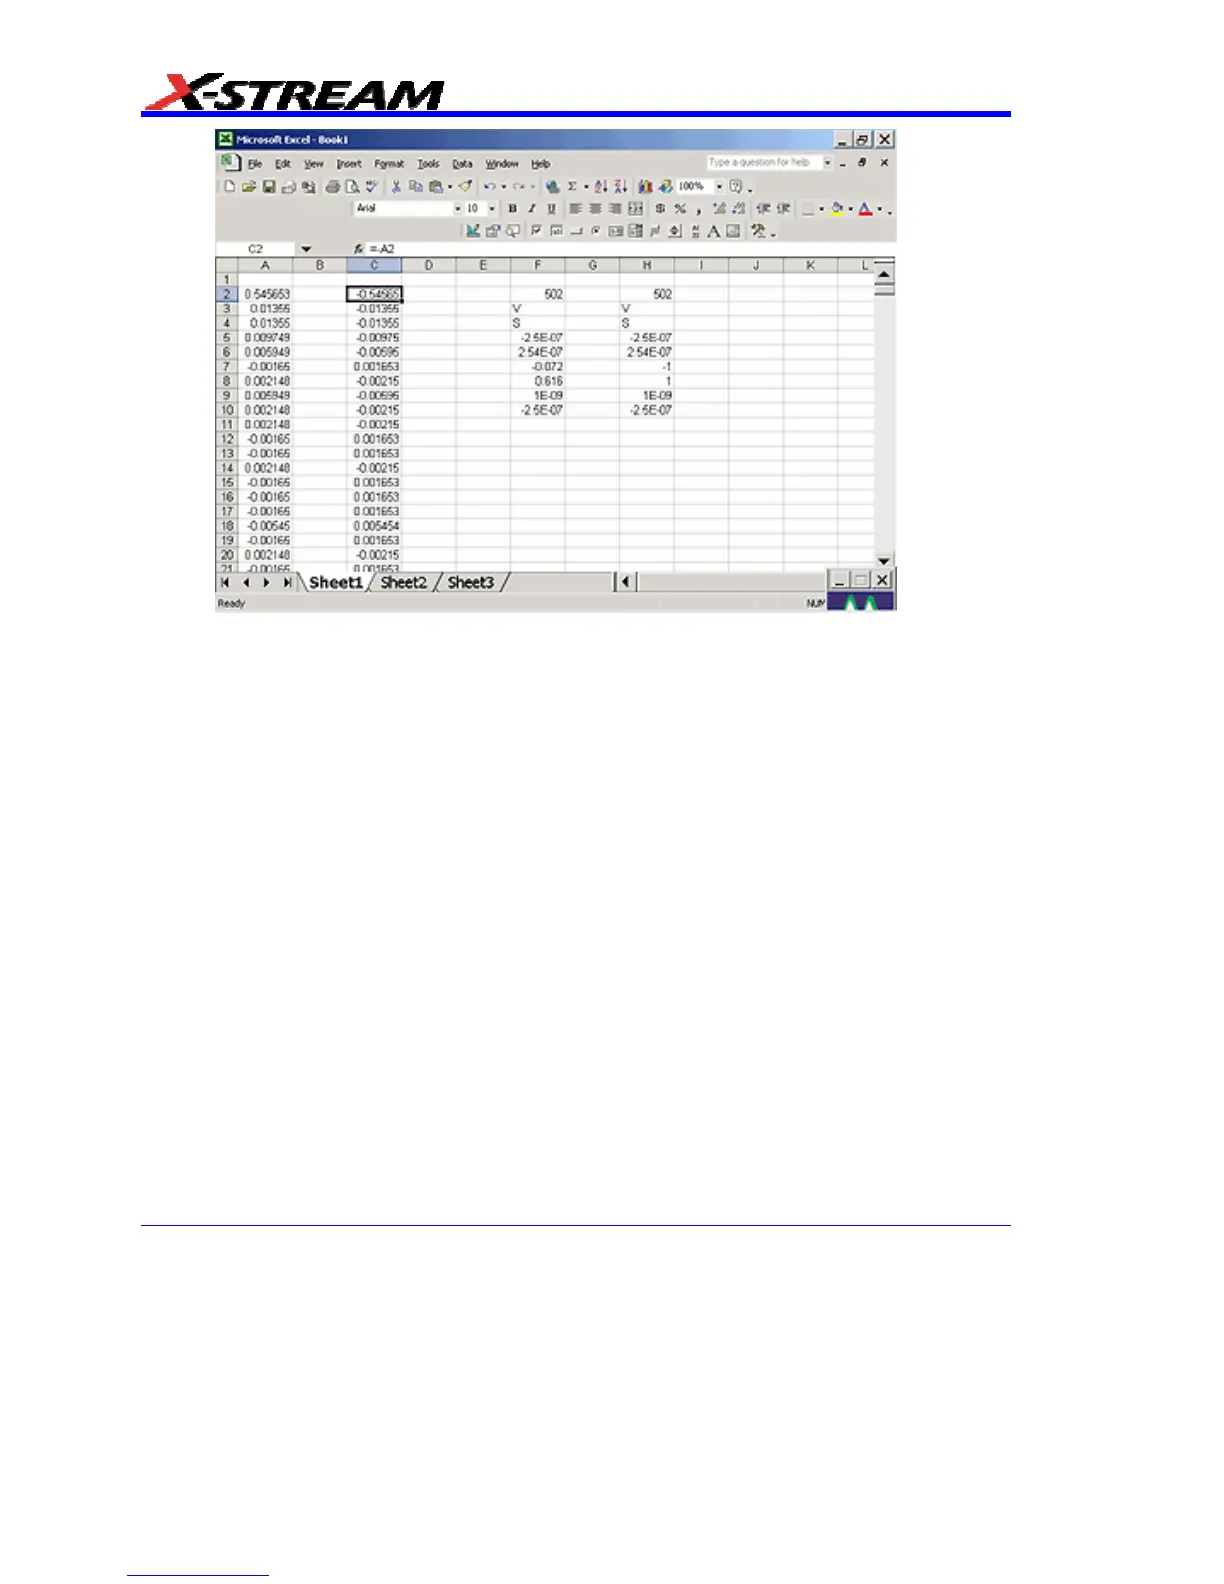
Note that the only action that was needed in Excel was to create the formula in column C for each
data point in column A. The instrument automatically opens Excel, puts the waveform data in the
correct columns, and returns the calculated data back to the display as the chosen F trace. This
Excel-calculated trace can have further measurements or math calculations performed on it, if
desired.
You can also create a chart of the data in Excel automatically and view the data there. Simply press
the Add Chart button in the instrument's Excel dialog and a chart of the input (top chart) and Excel
calculated output (bottom chart) will be automatically created in the spreadsheet. The chart will be
updated automatically as the scope is triggered.