6 - 24 Operator’s Manual
6 Image Acquisition
Perform the following procedure:
1. Perform image scanning, freeze the image and select a range of images for analysis; or select a
desired cine loop from the stored images.
The system set the starting time and ending time of the cine to be first frame and last frame of
QA analysis range.
2. Review the image to a desired frame.
3. Select [Contrast QA] to activate the function.
4. Mark out the interested part (ROI).
Up to 8 ROIs can be saved on the reference image, with the corresponding eight traces plotted
simultaneously on the graph. Each ROI display has a different color, and its corresponding
trace data is plotted using that same color.
a. Use [ROI Type] to select the method for determining the shapes of the sample area: Trace
ROI and Ellipse ROI.
The cursor is evolved in the image review area.
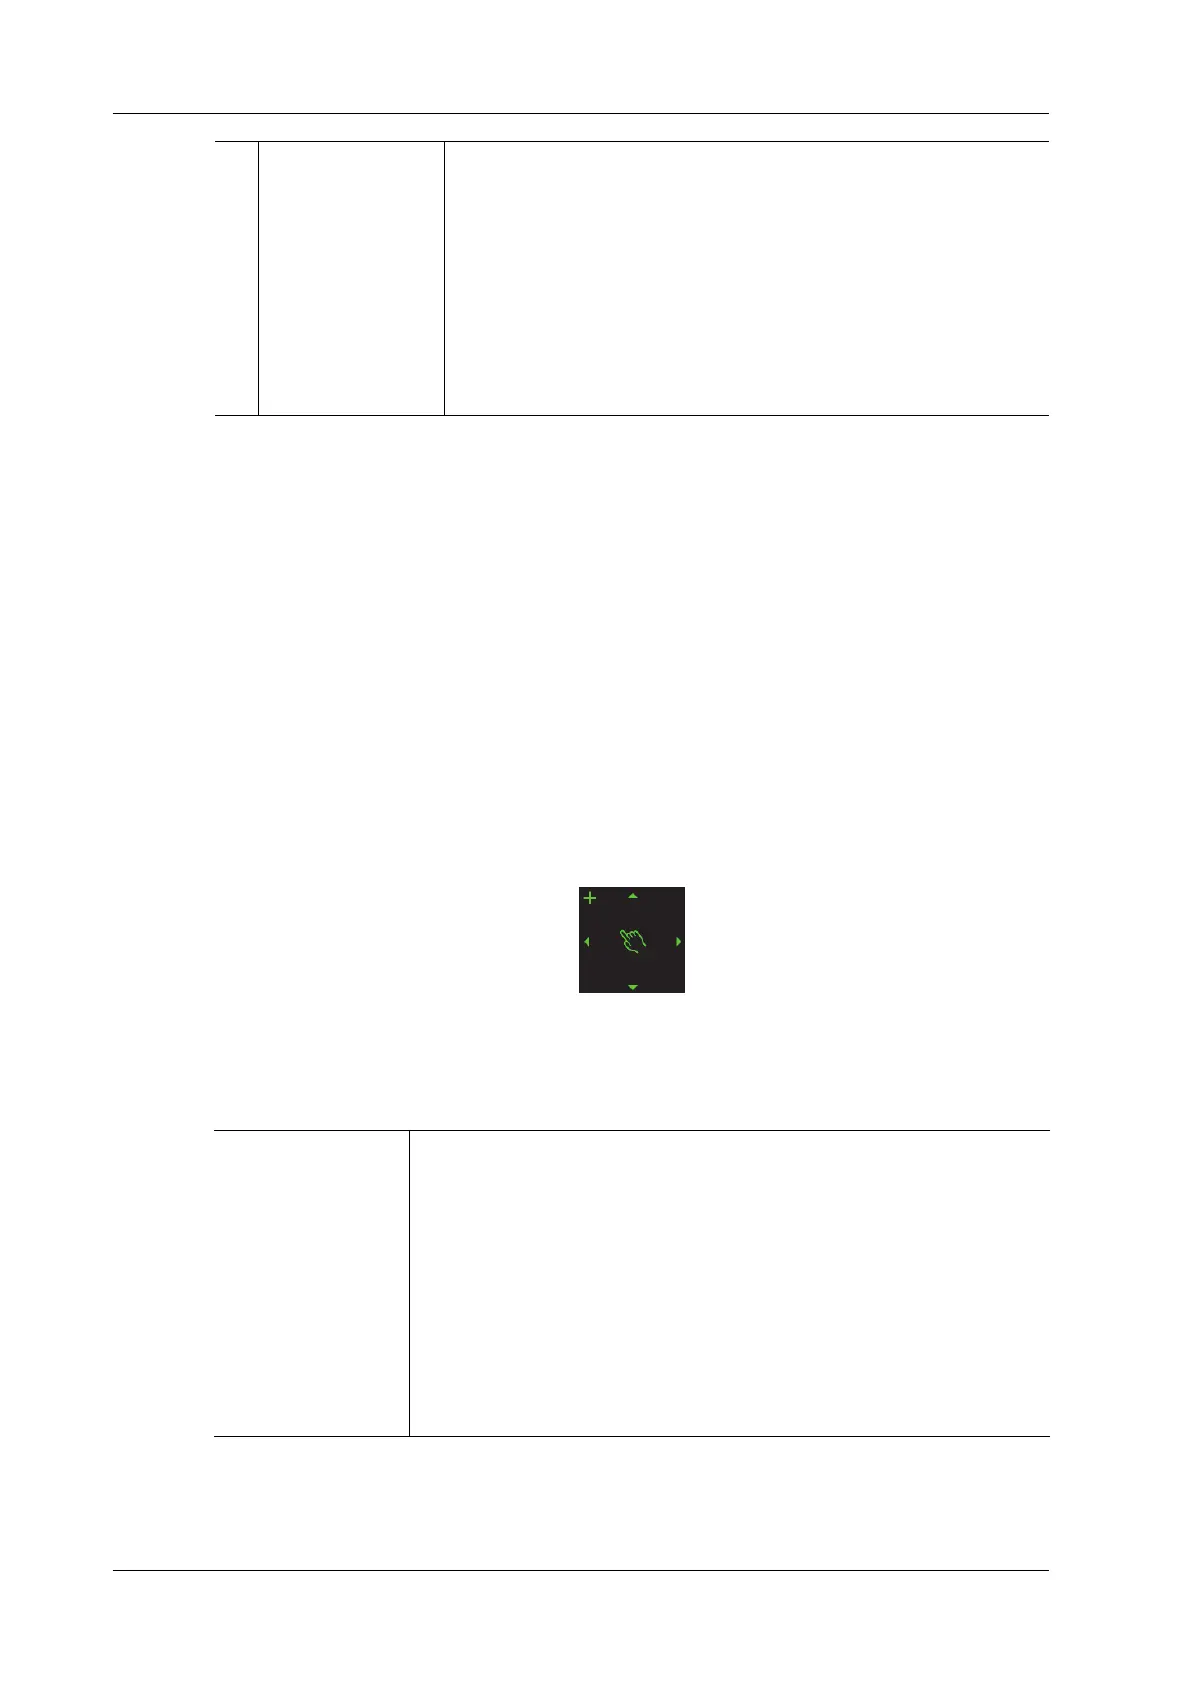
b. Move the cursor to position the caliper on the reference image at the start point.
Tap the arrows around the hand icon to fine-tune the cursor position if needed.
c. Tap the hand icon to fix the start point.
3 Time-intensity curve • Y axis represents the intensity (unit: dB), while X axis represents
the time (unit: s).
• Frame marker: a white line that is perpendicular to the X axis, can
be moved horizontally left to right (right to left) by using the
trackball.
• Click the check box beside the ROI to set if to hide or to display the
QA curve.
• You can get the current X/Y axis value by moving the cursor onto
one point on the curve; and if you press <Set> at this time, the
frame marker will move to the spot.
Trace ROI Follow the steps below:
1. Tap and hold the hand icon to move the cursor to the desired position,
you can also tap the arrows around the hand icon to fine-tune the cursor
position.
2. Tap the hand icon to fix the second point.
3. Repeat steps 1~2 above to fix more points.
4. When a suitable ROI has been drawn, confirm the ROI by double
tapping the hand icon.
The system automatically links the start point to the end point by
drawing a line between them.