6 Image Acquisition
Operator’s Manual 6 - 25
– Select [Delete All] to clear out all ROIs.
The corresponding traces for the deleted ROIs are erased from the plot.
– Select [Copy ROI] to create a new ROI similar to the current or latest added ROI
5. Select [Motion Tracking] to enable the Motion Tracking function.
This function provides a motion compensated ROI as precise time-intensity information can be
acquired using active tracking. It can enhance the calculation accuracy as reducing the impact
of probe or patient respiratory movement.
6. If necessary, select [Fit Curve] to perform curve fitting on the time-intensity curve, where color
of the fitted curve is consistent with color of the current ROI curve.
The system can calculate characteristic parameters according to curve fitting formula and data,
display fit curve for time-intensity curve, and perform data analysis on time-intensity curve for
data table.
– Select [Raw Curve] to hide/display raw curve.
– Select [Table Display] to check parameters:
You can set range for the fit curve. After the range is set, the system displays fit curve within
the range only. Use the trackball to the time-intensity curve to move the frame marker position.
Ellipse ROI Follow the steps below:
1. Tap and hold the hand icon to move the cursor to the desired position,
you can also tap the arrows around the hand icon to fine-tune the cursor
position.
2. Tap the hand icon to fix the end point.
3. Tap and hold the hand icon to depict the ROI.
Tap the arrows around the hand icon to fine-tune the cursor position if
needed.
4. When a suitable ROI has been drawn, confirm the ROI by double
tapping the hand icon.
The system automatically links the start point to the end point by
drawing a line between them.
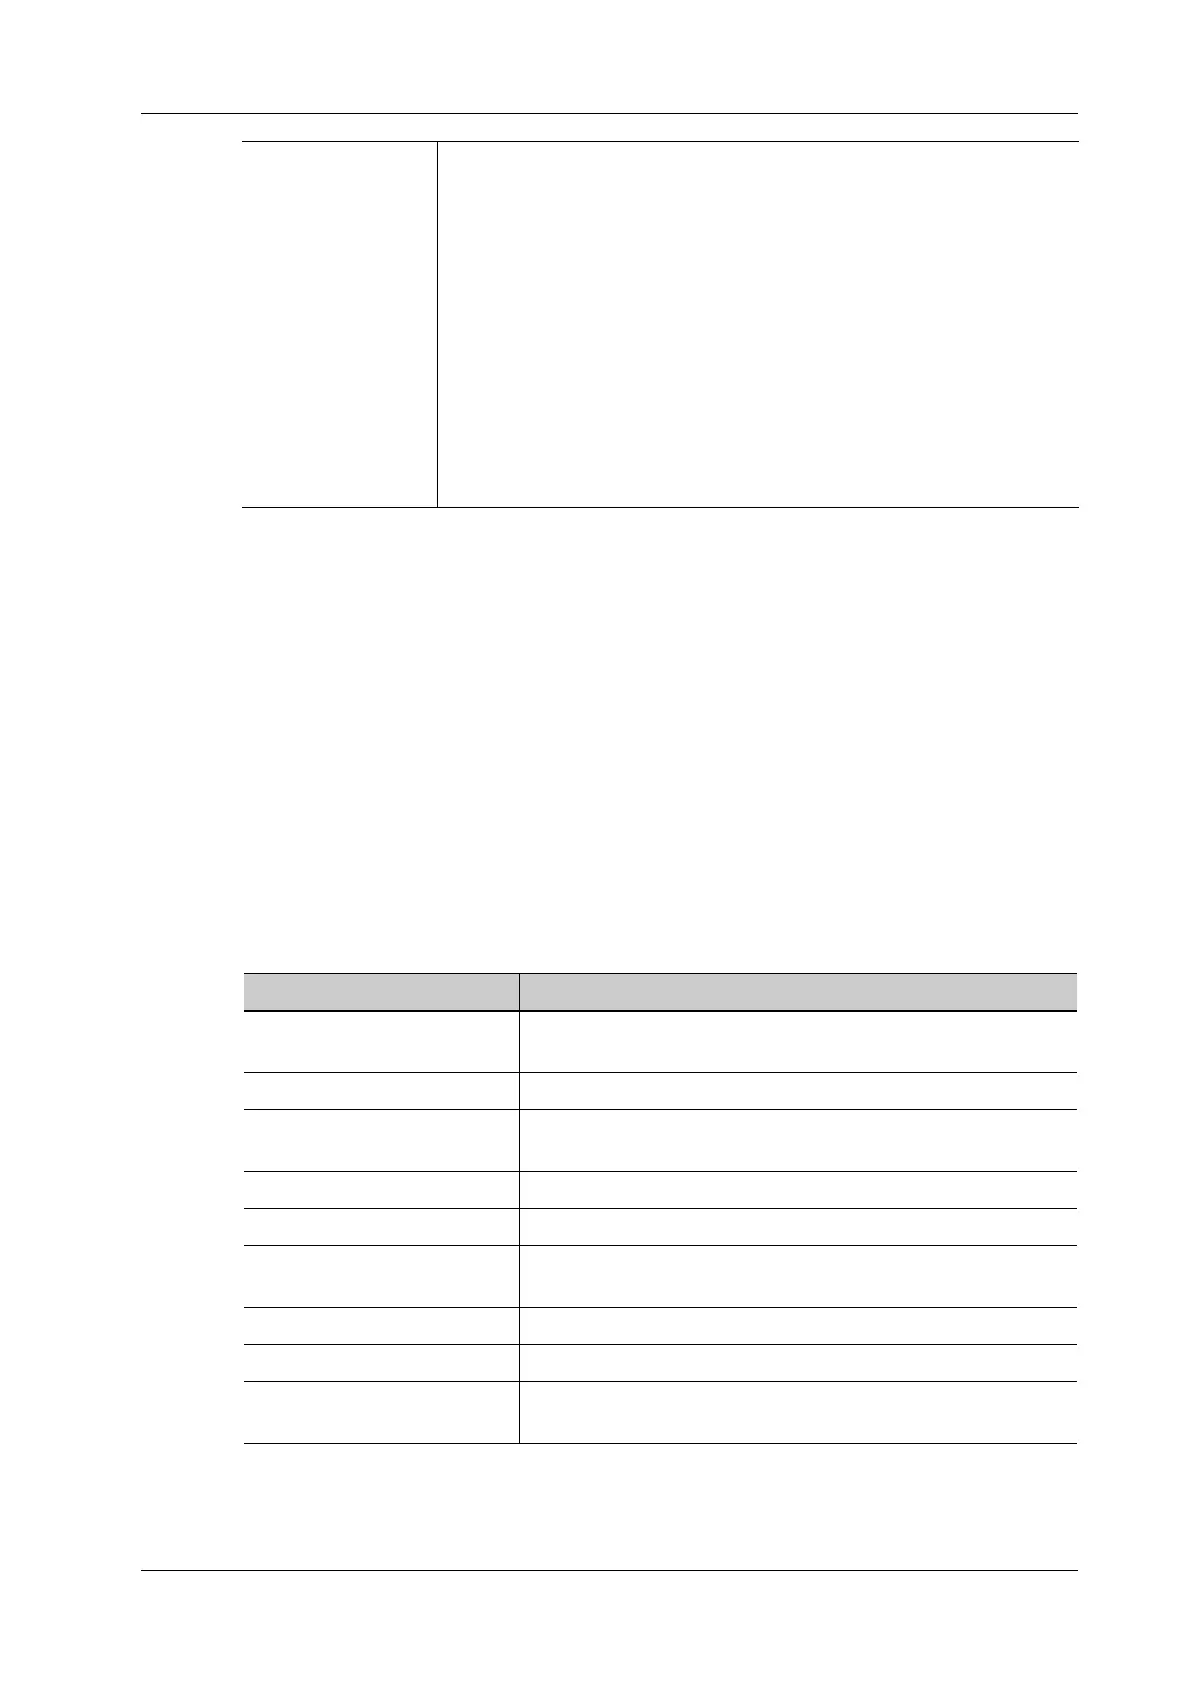
Item Description
GOF (Goodness of Fit) Calculate the fit degree of the curve; range: 0-1, where 1 means
the fit curve fits the raw curve perfectly.
BI (Base Intensity) Basic intensity of no contrast agent perfusion status.
AT (Arrival Time) Time point where contrast intensity appears, generally, the actual
time value is 110% higher than the base intensity.
TTP (Time To Peak) Time when the contrast intensity reaches peak value.
PI (Peak Intensity) Contrast peak intensity.
AS (Ascending Slope) Ascending slope of contrast, the slope between the start point of
lesion perfusion to the peak.
DT/2 Time when the intensity is half the value of the peak intensity.
DS (Descending Slope) Descending slope of the curve.
AUC (Area Under Curve) To calculate the area under the time-intensity curves during
contrast.