9 Visualization
Maschinenfabrik Reinhausen GmbH 2020 2796385142/08 EN ETOS
®
ED
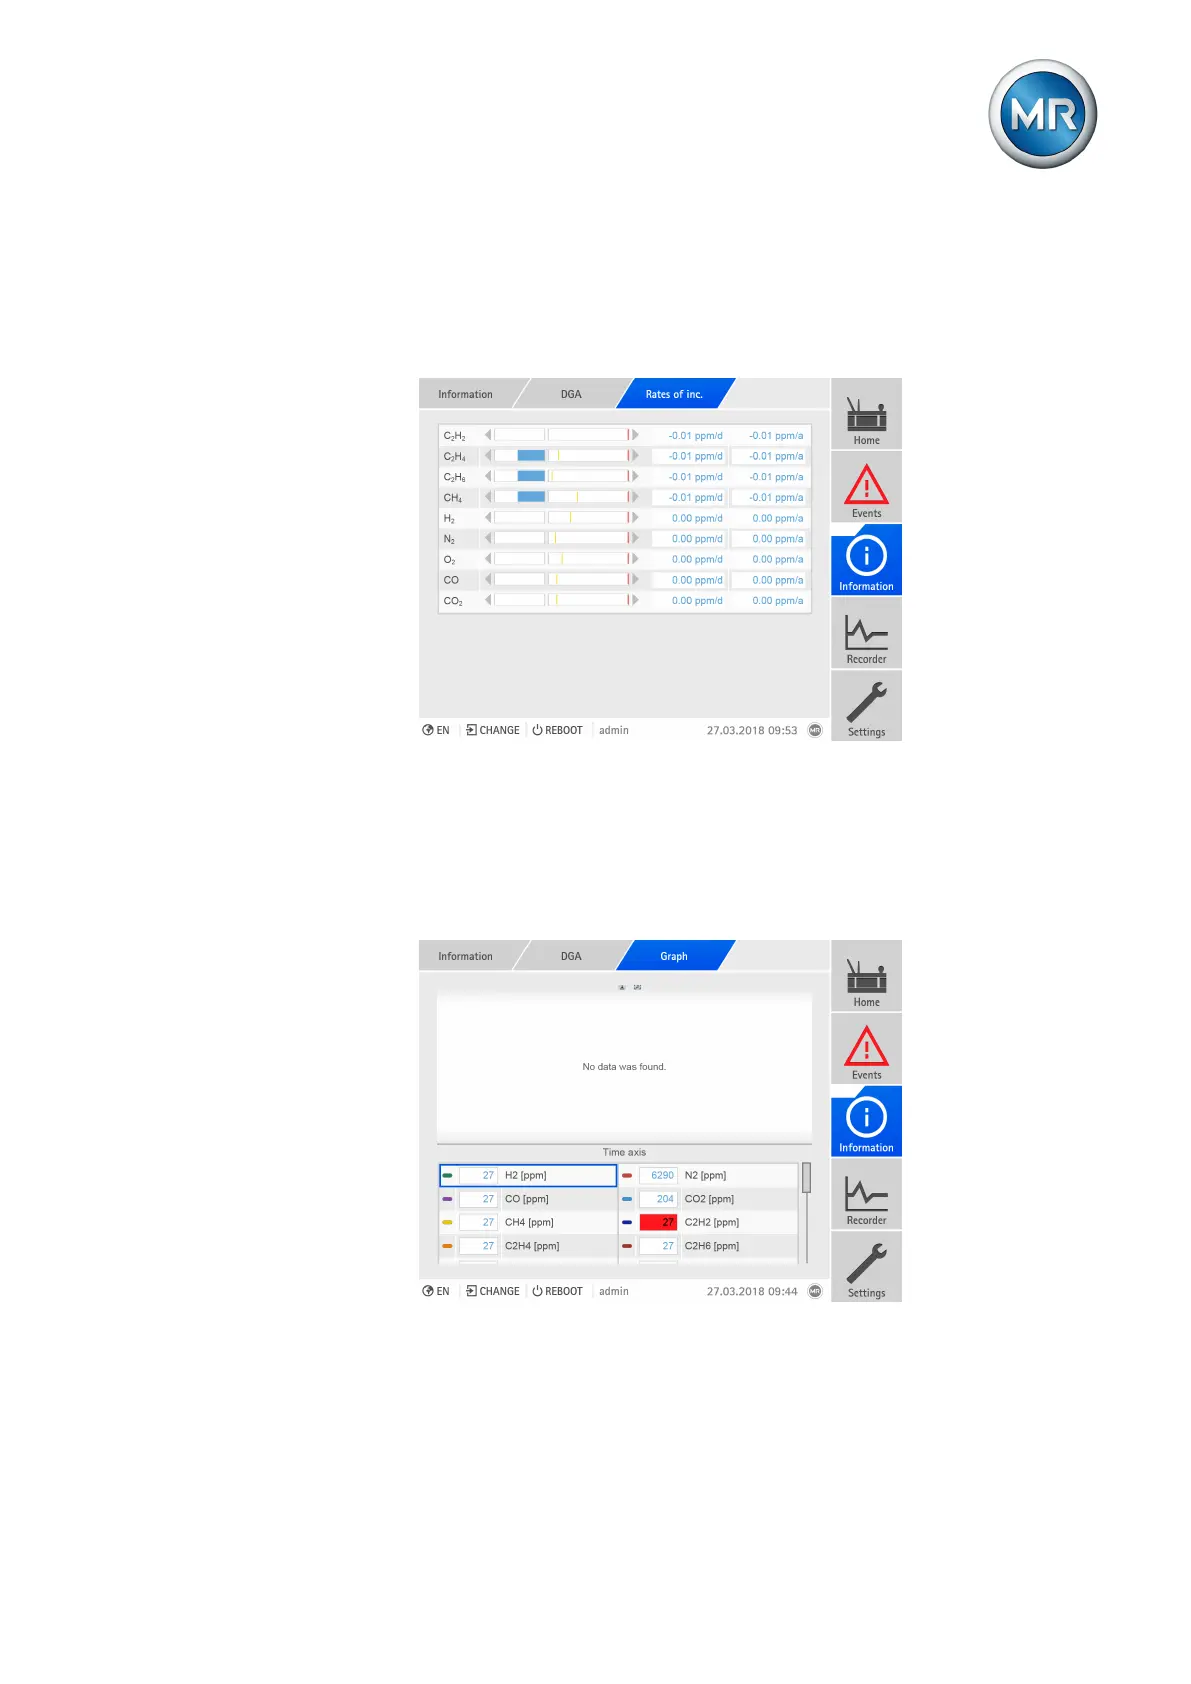
9.27.2.2 Rates of increase
You can display the calculated rates of increase of the gases (ppm/d and
ppm/y). The bar chart shows a graphical representation of the actual rate of
increase (ppm/d) and the set limit values (yellow, red). The set evaluation in-
terval is the decisive factor for the display of rates of increase.
Figure203: Displaying the rates of increase
► Go to Information > Active part > DGA > Rates of increase.
9.27.2.3 Measured value trend
You can display the temporal progression of the measured DGA measure-
ments over the last 10 days. To do so, proceed as follows:
Figure204: DGA measured value trend
► Go to Information > Active part > DGA > Graph.
You can also display the DGA measured value trend over a time period that
you define. You will find more information on this in the section "Measured
value recorder" [►Section 9.24.2, Page 248].