9 Visualization
Maschinenfabrik Reinhausen GmbH 2020280 6385142/08 ENETOS
®
ED
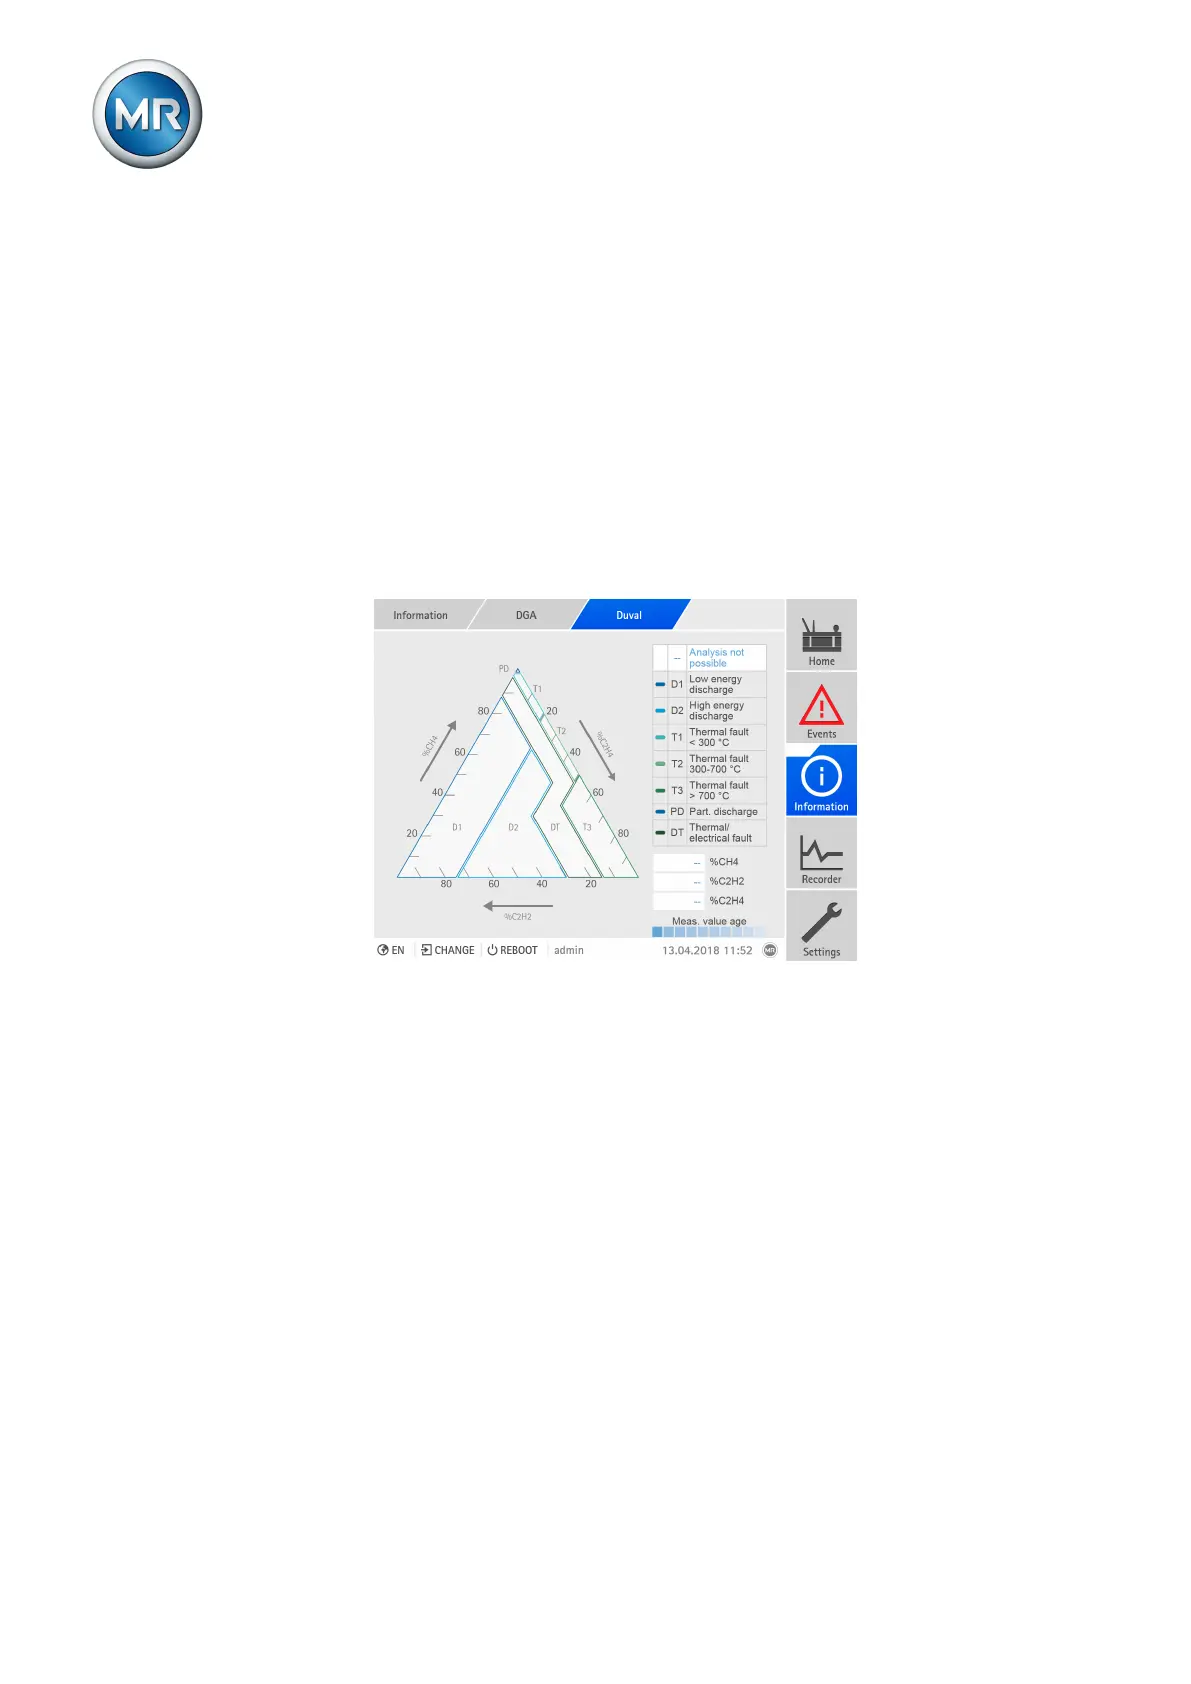
9.27.2.4 Duval analysis
The display of the Duval analysis shows the following information:
▪ Duval triangle, with the allocation of the last 10 measured values in the ar-
eas of the various error types.
– Latest measured value: Darkest area with a display of the measure-
ment error.
– Earliest measured value: Lightest area
▪ Display of the error types. The error type of the latest measured value is
highlighted in white.
▪ Gas concentrations of the latest measured value
If you call up the visualization using a PC, the gas concentrations and the
time of the measurement are displayed for each measured value via tooltip.
Figure205: Display of the Duval analysis
► Go to Information > Active part > DGA > Duval.
9.27.2.5 Rogers analysis
The display of the Rogers analysis shows the following information:
▪ 3D diagram, with the allocation of the last 10 measured values in the ar-
eas of the various error types.
– Latest measured value: Darkest area with a display of the measure-
ment error.
– Earliest measured value: Lightest area
▪ Display of the error types. The error type of the latest measured value is
highlighted in white.
▪ Proportion of the gas concentrations of the latest measured value