33.6.6
%heTEMPGRAPH
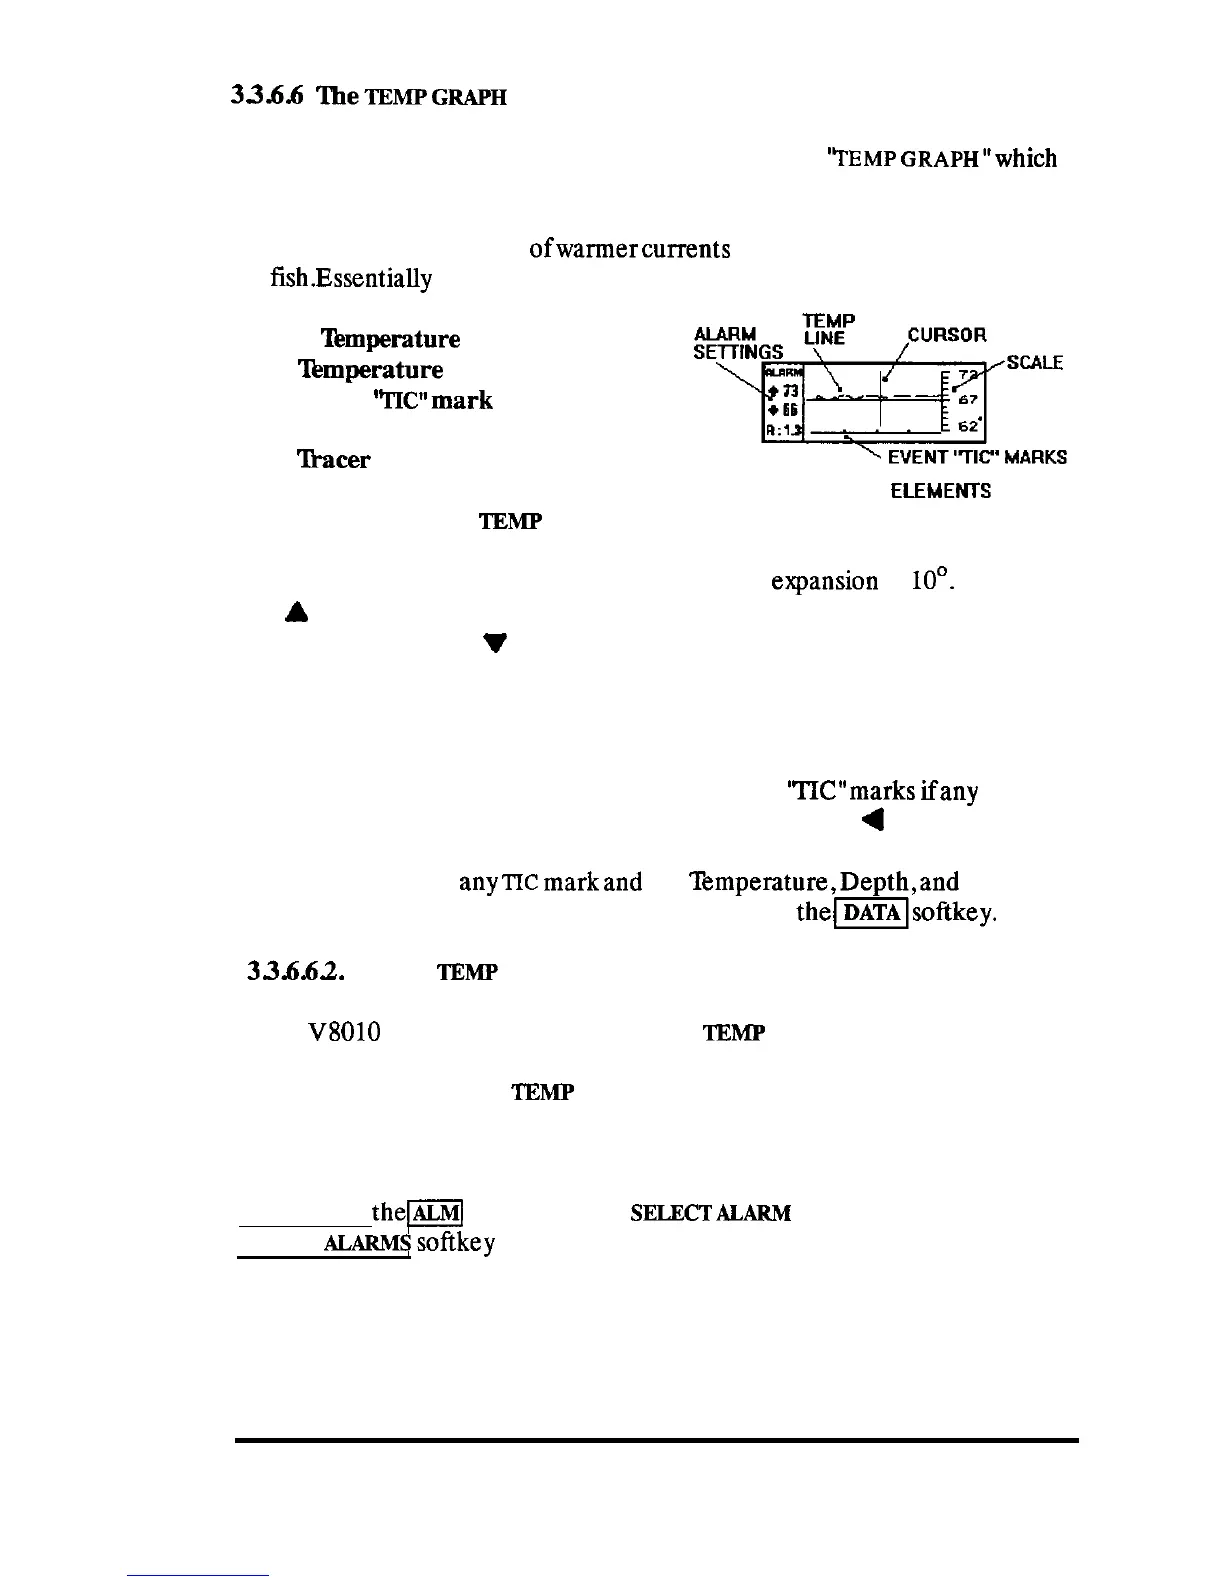
The bottom section of the display shows the unique
‘TEMP
GRAPH”W~~C~
provides a record of the surface water temperature changes in graphical
form. This feature is particularly useful while sports fishing to locate the
subtle temperature breaks
ofwarmercurrents
which can mean the presence
of fish.Essentially the
TEMP Graph has the following five main parts:
1.
‘lbmperature
Graph scale
2.
‘Ibmperature
Graph line
3. Event
YlX?mark
line
4. Temperature Alarm status box
5.
%acer
cursor
sEy!$yq~;~
TEMP GRAPH ELEMEHTS
33.6.6.1 Centering the
TEMP
GRAPH
The Temperature Graph scale has a fixed scale
elrpansion
of
loo.
Pressing
the
1,
(up) key will shift the temperature line upward onto the center of
the graph scale. The
v
(down) moves the temperature line down to the
graph scale. Use these keys to put your surface water temperature at the
graph mid-point.
The graph represents approximately the last hour of plotted temperature
points. A line below the graph is used to show the
“IX”marks
ifany
Events
entered during the time of the graph. If you move the
4
(left) direction
key, a vertical cursor appears on the Temp Graph. The cursor can be
superimposed over
anync
markand the
Temperature,Depth,and
Position
data of the Event can then be recalled
by
pressing
thellsoftkey.
3X6.62.
Setting
TEMP
Alarms
The
V8010
has operator programmable
‘IIMP
alarms that you can set to
advise you when the specified surface water temperature limits have been
reached. The types of
TEMP
alarms available are: UPPER LIMIT, LOWER
LIMIT, and RATE OF CHANGE.
Quick access to set, change, or cancel these Temperature alarms is gained
by pressing
them
key. When the
SELECT
ALARM
menu appears, press the
TEMP
ALARMS
softkey and the
SET TEMP ALARMS menu will appear, as
shown.
OPERATION 70