1250 Frequency Response Analyzer Recording, Learning and Storing Facilities
SH/1250/3 12-17
Key in and ENTER the required X-axis and Y-axis origin values between the round
brackets.
For this example plot enter the X-axis ORIGIN as 0, and the Y-axis ORIGIN as - 1,
which avoids points being plotted on the axes.
12.4.5 THE [PLOTTER SCALING] MENU
Set up the [PLOTTER SCALING] page of the DISPLAY/PLOTTER menu.
This section of the menu is concerned with the size and aspect ratio of the plotting field,
and its position on the paper.
There are five soft keys:
SCALE X-MIN Y-MIN X-MAX Y-MAX
[ fixed ] ( ) ( ) ( ) ( )
[variable]
a. SCALE [ fixed ]
With SCALE set to [ fixed ], the default state, the size of the plotting field is matched
by the 1250 to the paper size selected (A3 or A4); the shape (square or rectangular)
is determined solely by the ITEM choice (see Section 12.4.4a above).
b. SCALE [variable]
With SCALE set to [variable] the user may freely adjust the size, aspect ratio, and
position on the paper of the plot. The size and proportions of any annotations are
automatically adjusted by the 1250 to suit those of the chosen plotting field.
Press the SCALE soft key then SELECT and ENTER [variable]. Then press the X-
MIN soft key. The display becomes:
X-MIN not entered (+ )
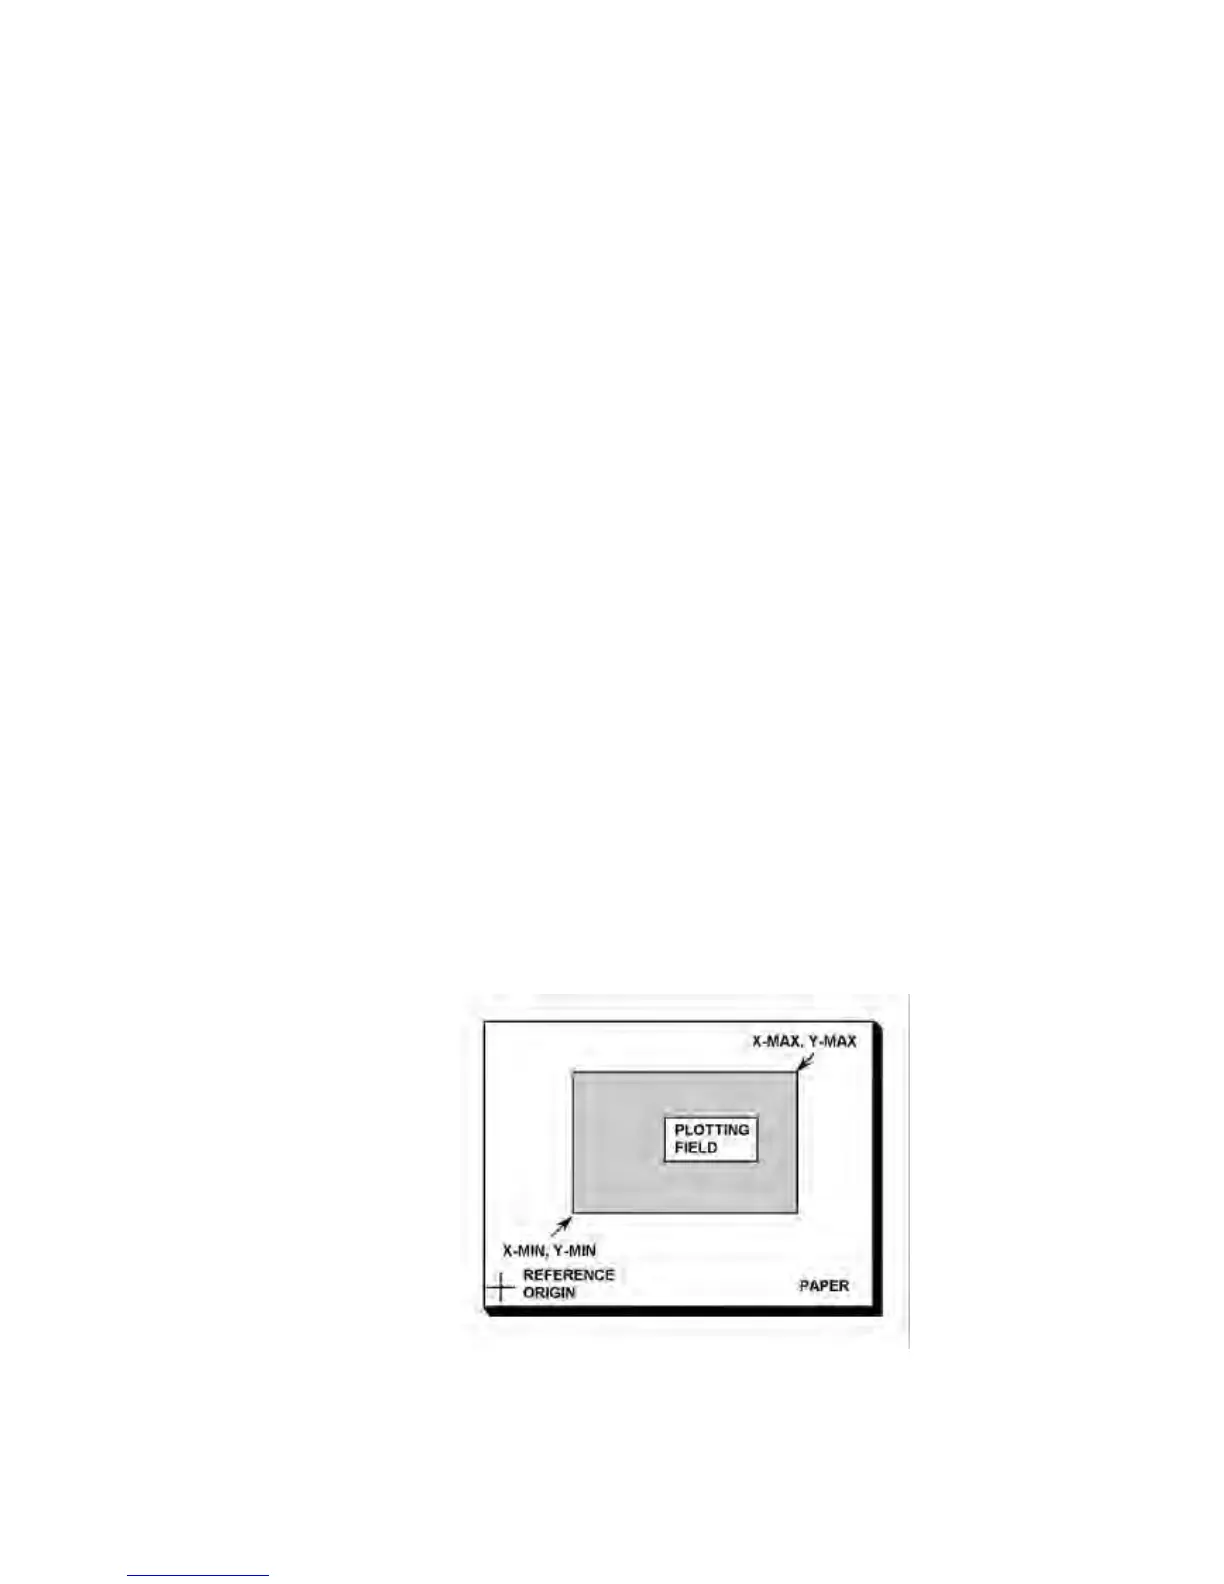
Key in and ENTER the value of the X-coordinate of the lower left-hand corner of the
required plotting field, if this is known. This value of X-MIN is an integer from 0 to
32000. It is equivalent to 0.025 mm per unit, measured in the X-direction from a
reference origin which is approximately at the lower left-hand limit of the plotting area
(see Fig. 12.3).
Figure 12.3 - Coordinates of the plotting field