Frequency Response Analyzer Additional Generator Controls
AMK/1250/2 9-7
In order to hold the Intermediate Signal as closely as possible to its target value, and not
merely within the tolerance band, the 1250 computes and applies any correction
necessary to the Generator Output after displaying each reading.
The sequence of events is shown in the flow diagram, Fig. 9.5.
A typical sequence, when using Amplitude Compression with a Sweep, is shown
graphically in Fig. 9.6. The ERROR 84 condition does not occur in this example.
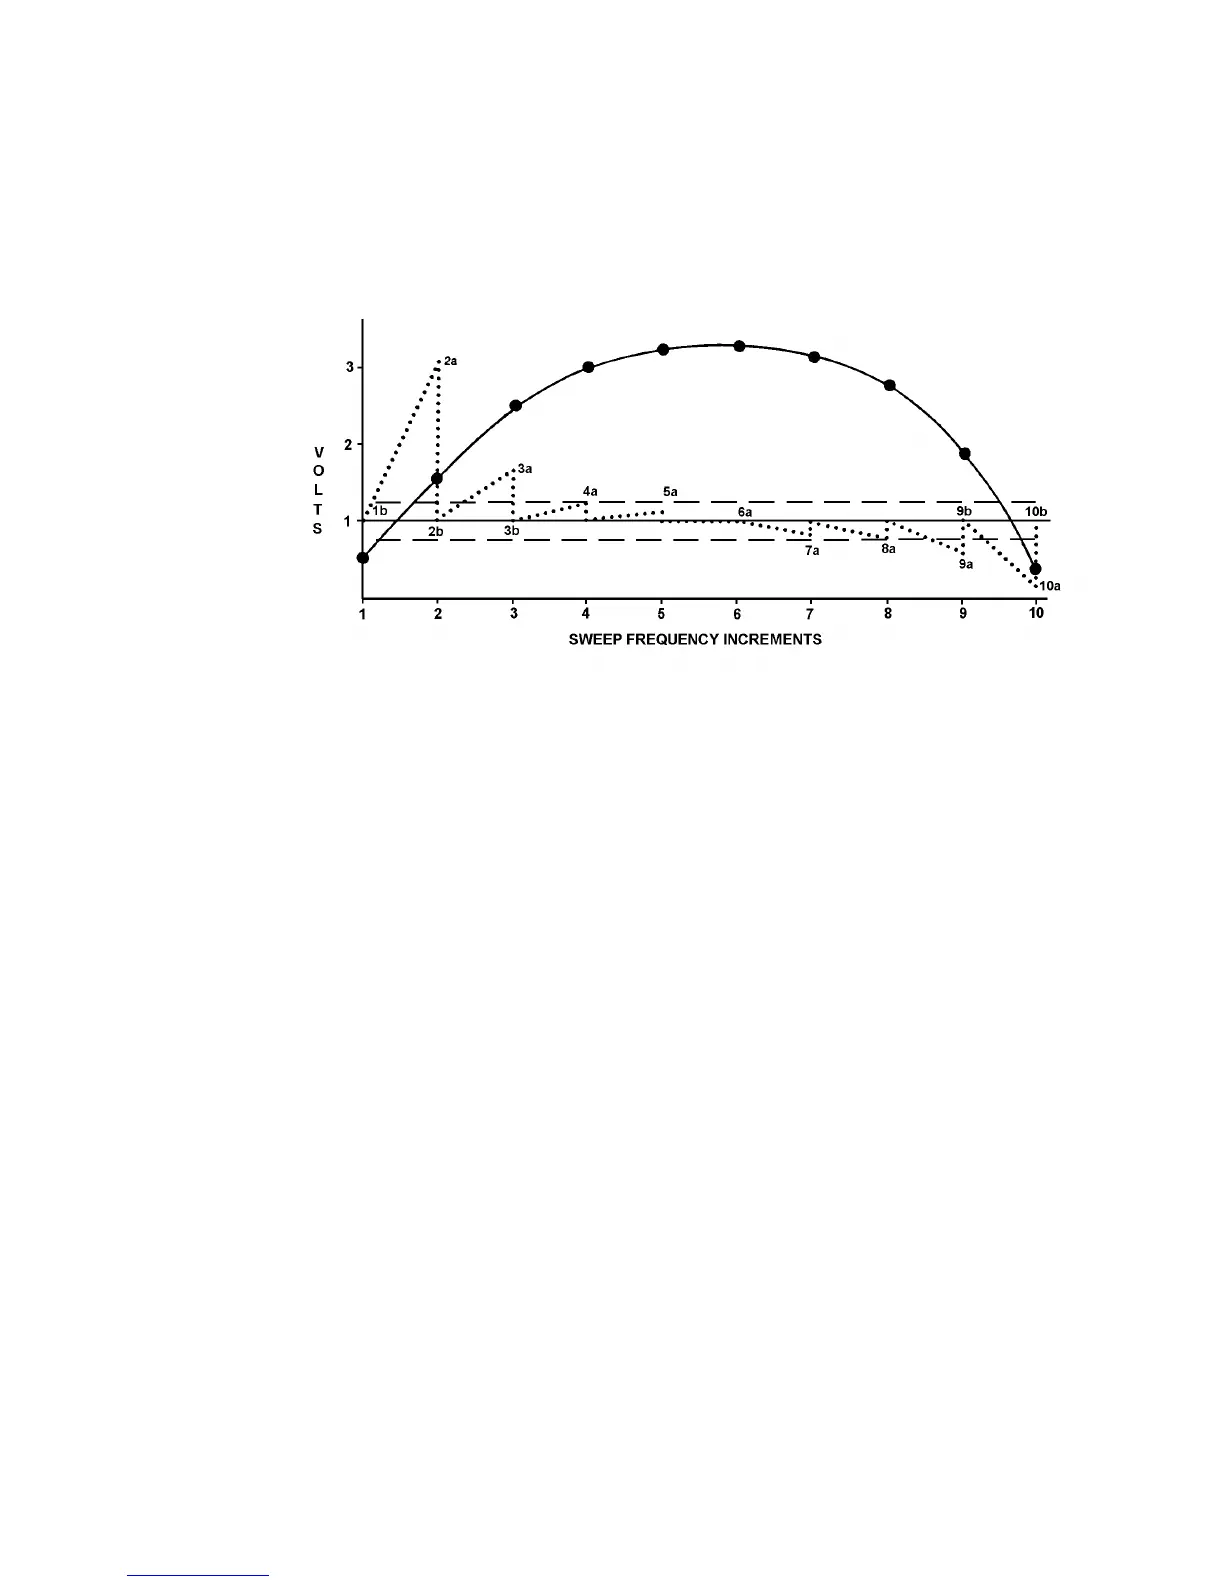
Figure 9.6 - Graphical Example of Amplitude Compression.
The solid curve represents the frequency response of the system under test, as it would
appear at the monitored point without Amplitude Compression. The sweep steps are
numbered from 1 to 10 along the base line.
Superimposed on this curve is the example quoted earlier of a nominal 1 volt level of
Amplitude Compression ± 25% error.
The dotted line shows the actual signal levels which appear at the monitored point as a
result of the Amplitude Compression. The numbers 1a, 1b, 2a, 2b etc. represent the
measurements made at each new frequency. Note that where the first measurement
shows the signal to be between the permitted levels, only one measurement is made,
e.g. at step 4.
9.2.3 GENERATOR OUTPUT LIMIT
If the Amplitude Compression feedback loop fails to gain control then the Generator
output steadily increases to the maximum value achievable, which could exceed some
prescribed 'safe' level for driving the system under test.
The LIMIT facility in the Amplitude Compression menu allows a maximum safe
operating amplitude to be specified which cannot be exceeded even if the compression
loop fails.