1250 Frequency Response Analyzer Making Measurements: The Analyzers
AMK/1250/3 5-5
Auto-integration can also be used to reduce sweep time when the signal-to-noise ratio
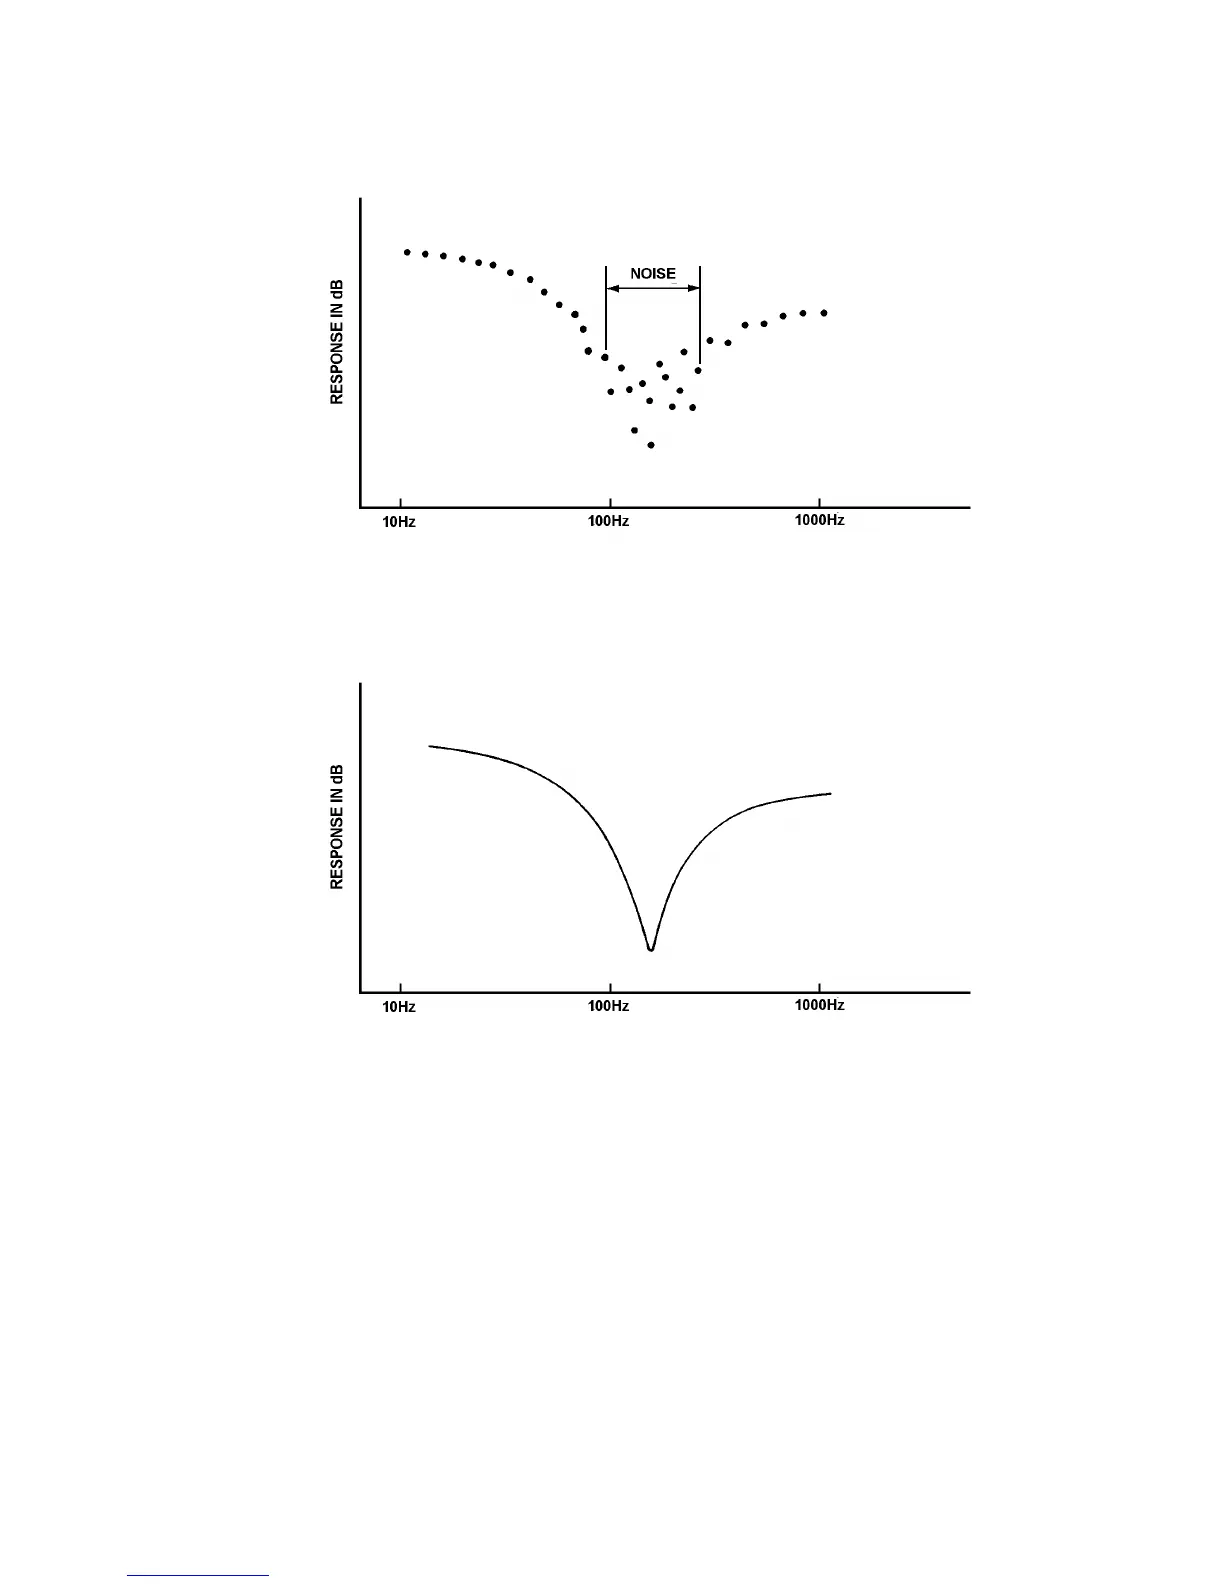
varies widely across the swept spectrum. Consider the points plotted in Fig. 5.2.
Figure 5.2 - Plot of readings from a sweep measurement
Either side of the band marked "noise", a fairly clear curve is indicated, as represented
in Fig. 5.3. A short integration time will suffice here.
Figure 5.3 - Idealised curve from Fig. 5.2
As the scatter on the readings increases as shown towards the centre of Fig. 5.2, the
integration time must be lengthened until it is at a maximum where the wanted signal is
completely obscured by noise. This process will yield a plot which approaches the
idealised curve of Fig. 5.3.
If a fixed integration time is chosen, this must be long enough to cope with the noisiest
part of the signal. Hence it will be unnecessarily long where the signal is relatively
clean. Auto-integration solves this problem as illustrated by the following example.
Example
With fixed integration time. Suppose that this must be 10 seconds in the noisiest
region. If the sweep consists of 60 steps, the sweep time would therefore be
60 X 10 = 600 seconds = 10 minutes