3 Design and functional description
Displays the type of trigger used (see chapter 4.2.3).
3.2.9 Graphic display
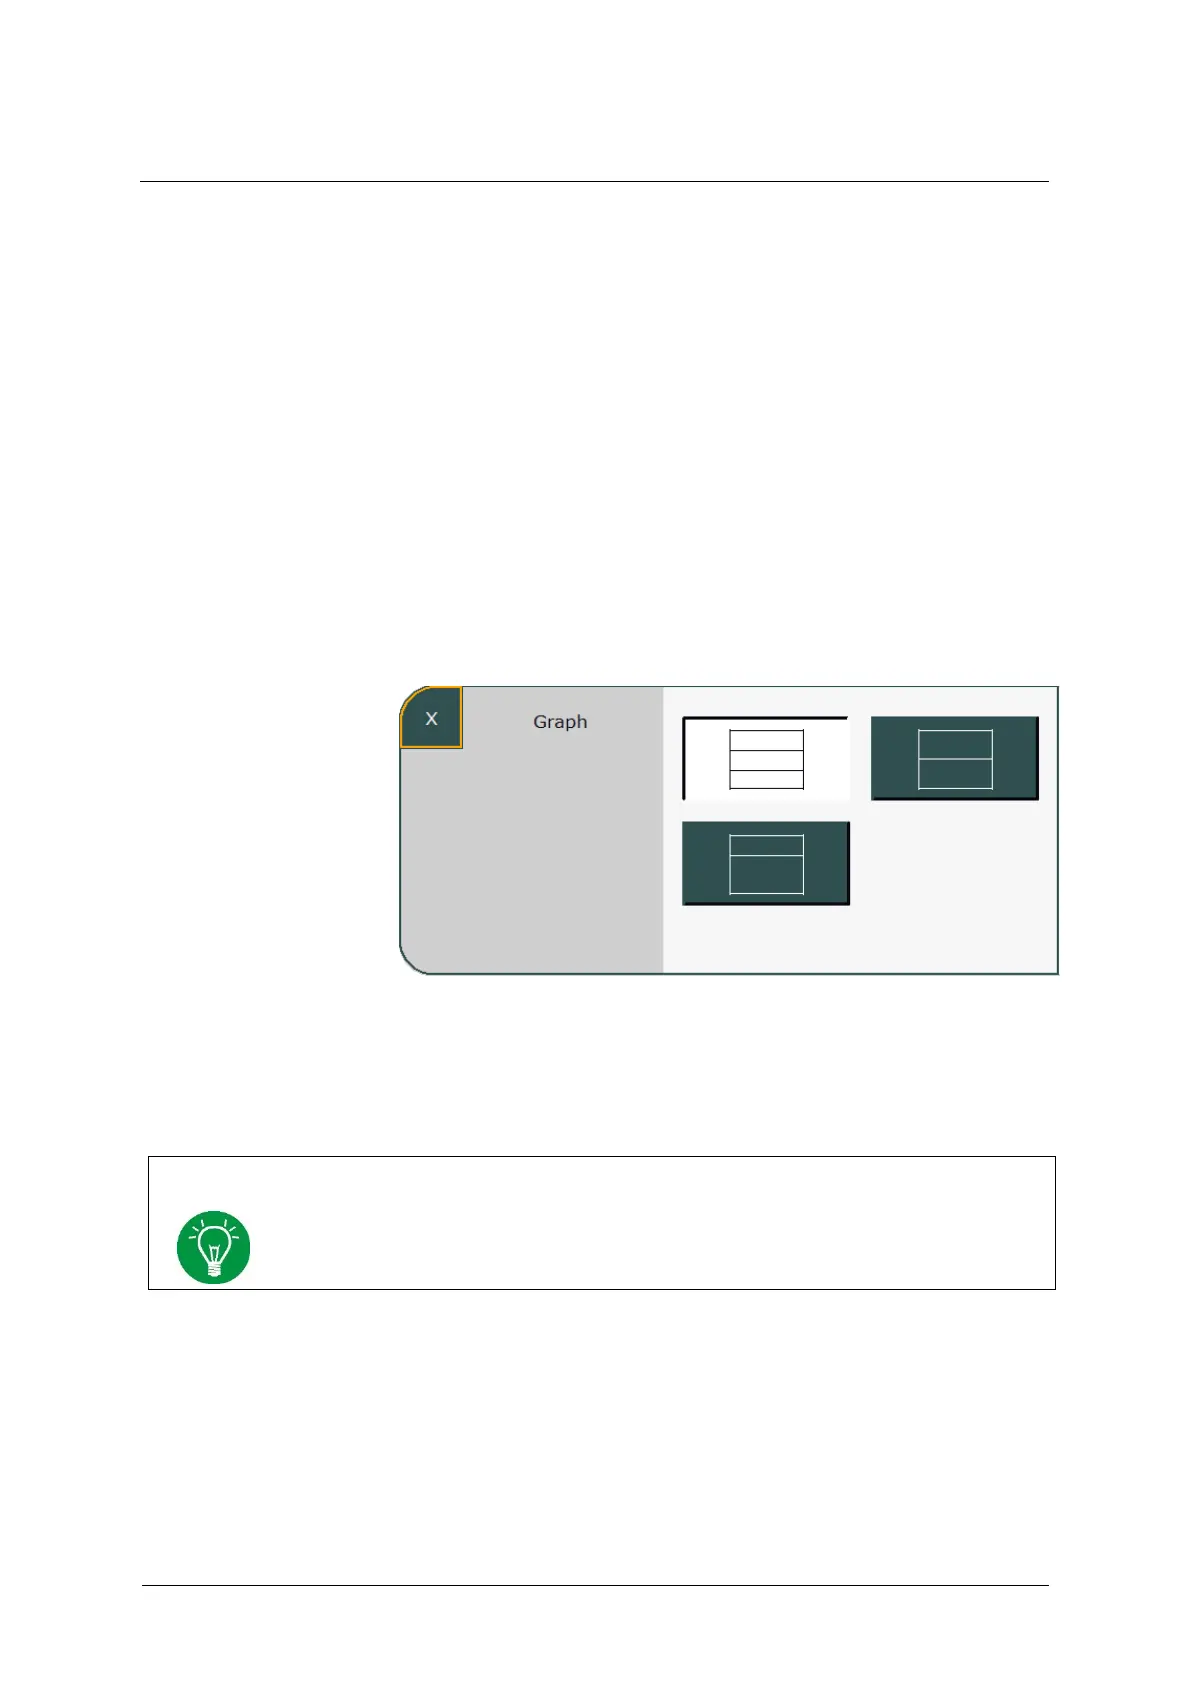
Pressing the »Graph« button (see chapter 3.2.3.5) opens the graphic
display, which can be customized. The initial layout can be pre-
configured in the system settings (see chapter 4.1.2). Three different
layout versions are available.
1. Display of three curves
2. Display of two curves
3. Display of one curve, loop or trend
.
Fig. 32: Graphic display configuration
The top field of the graphic display always shows the pressure curve. The
remaining fields can be freely configured by selecting them.
The system automatically adapts the scaling of the curves and scales to the current
measured values.