3 Design and functional description
Pressing the »X« field closes the selection window and updates the
graphic display with the new setting.
For a better view, the measurement curves can be frozen on the display.
To do this, press the "Stop" field in the selection window. After
activation, the measurement curves run until the end of the scale and are
then frozen. This mode is ended by pressing the "Stop" field or
automatically after 20 s have passed.
Configuration of loops and trends 3.2.9.2
Layout 3 provides the option of displaying loops and trends.
The lower field of the graphic display must be pressed for this. A sub-
menu opens and the user can choose between loops and trends by
selecting the corresponding field.
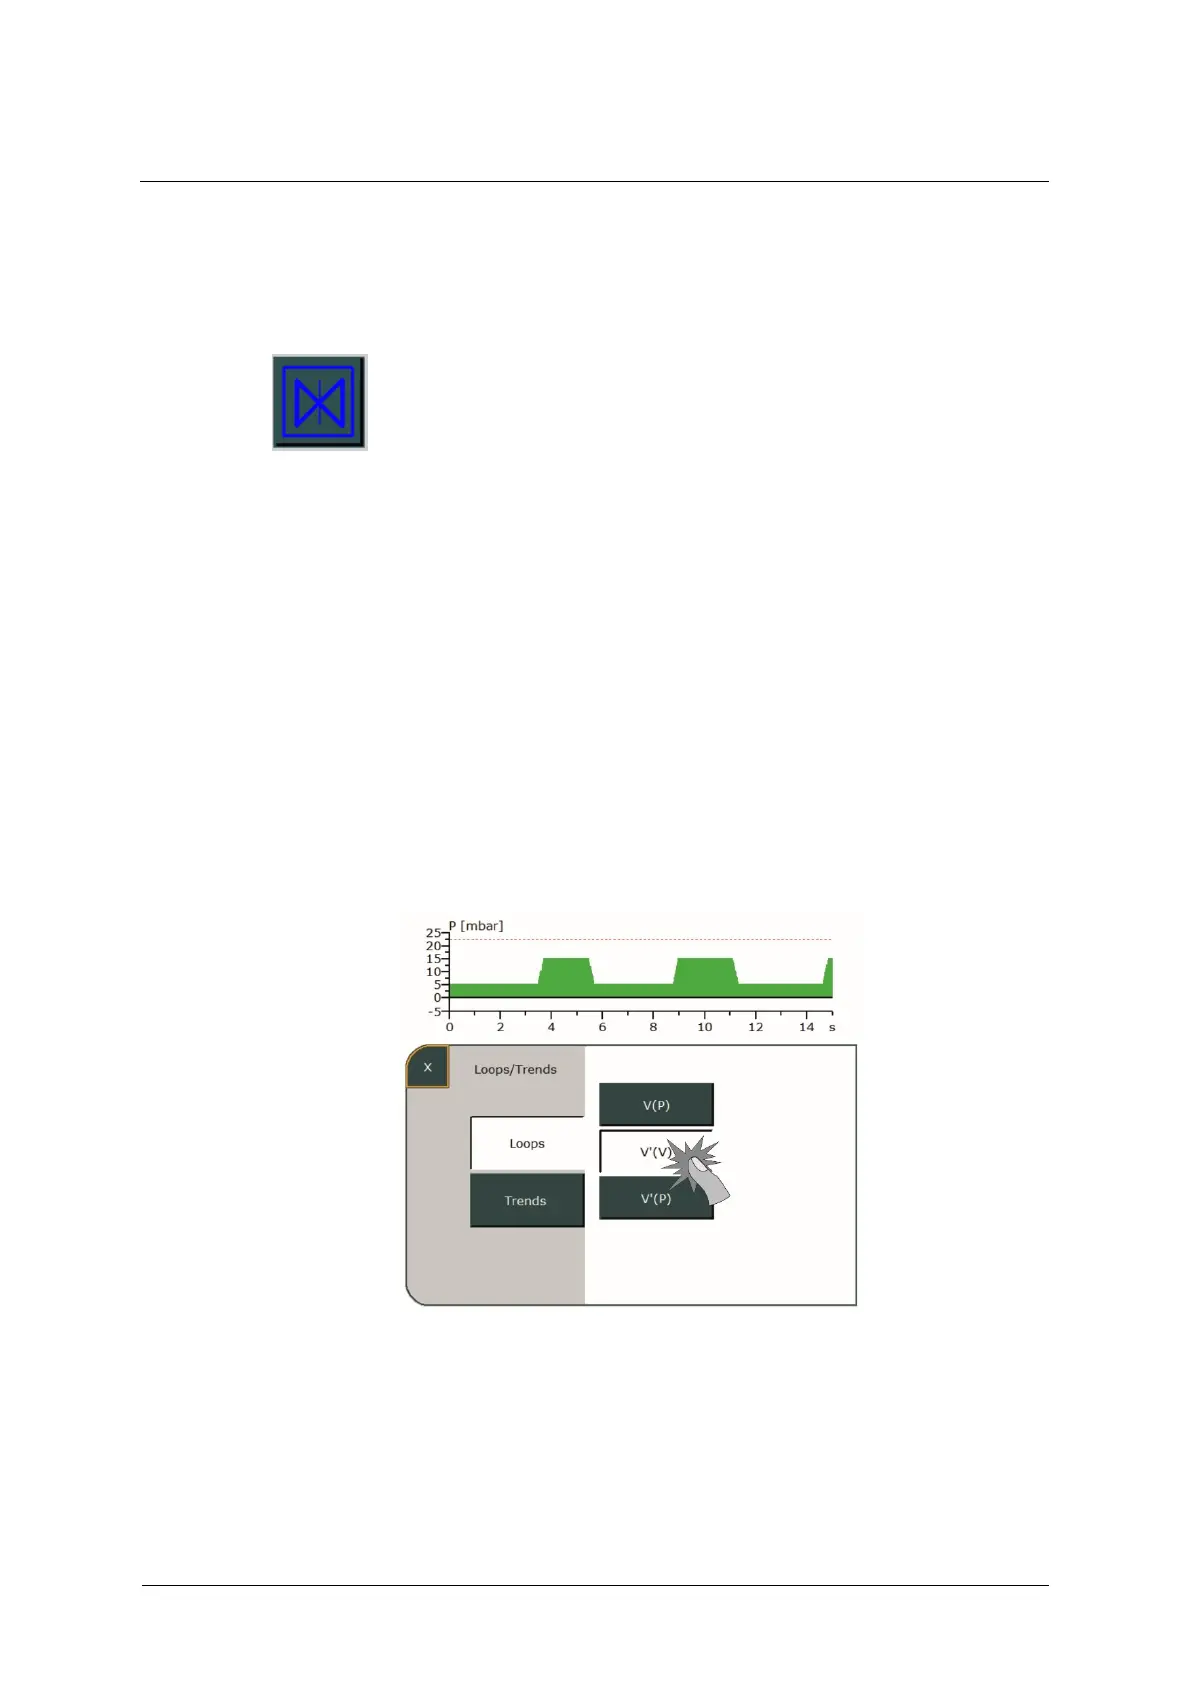
If the »Loops« field is selected, available options are displayed on the
right. Pressing the corresponding field lets you display the desired loop in
the graphic display.
Fig. 35: Selecting loops
Pressing the »X« field closes the selection window and shows the loop
including its measured values in the graphic display.