Page 65
Bar Graph
The eye can catch trends more rapidly by watching a moving object than
the brain can figure out by interpreting changing numbers. For this reason,
Sprint LC shows test trends on a moving bar graph. Watching the bar
graph, operators immediately see whether pressure or flow goes up or
down and how fast values change. The bar graph is not intended to be a
calibrated measurement – that’s the job of the main digital readout.
How the bar graph behaves depends on the test type being run and what
phase the test is in.
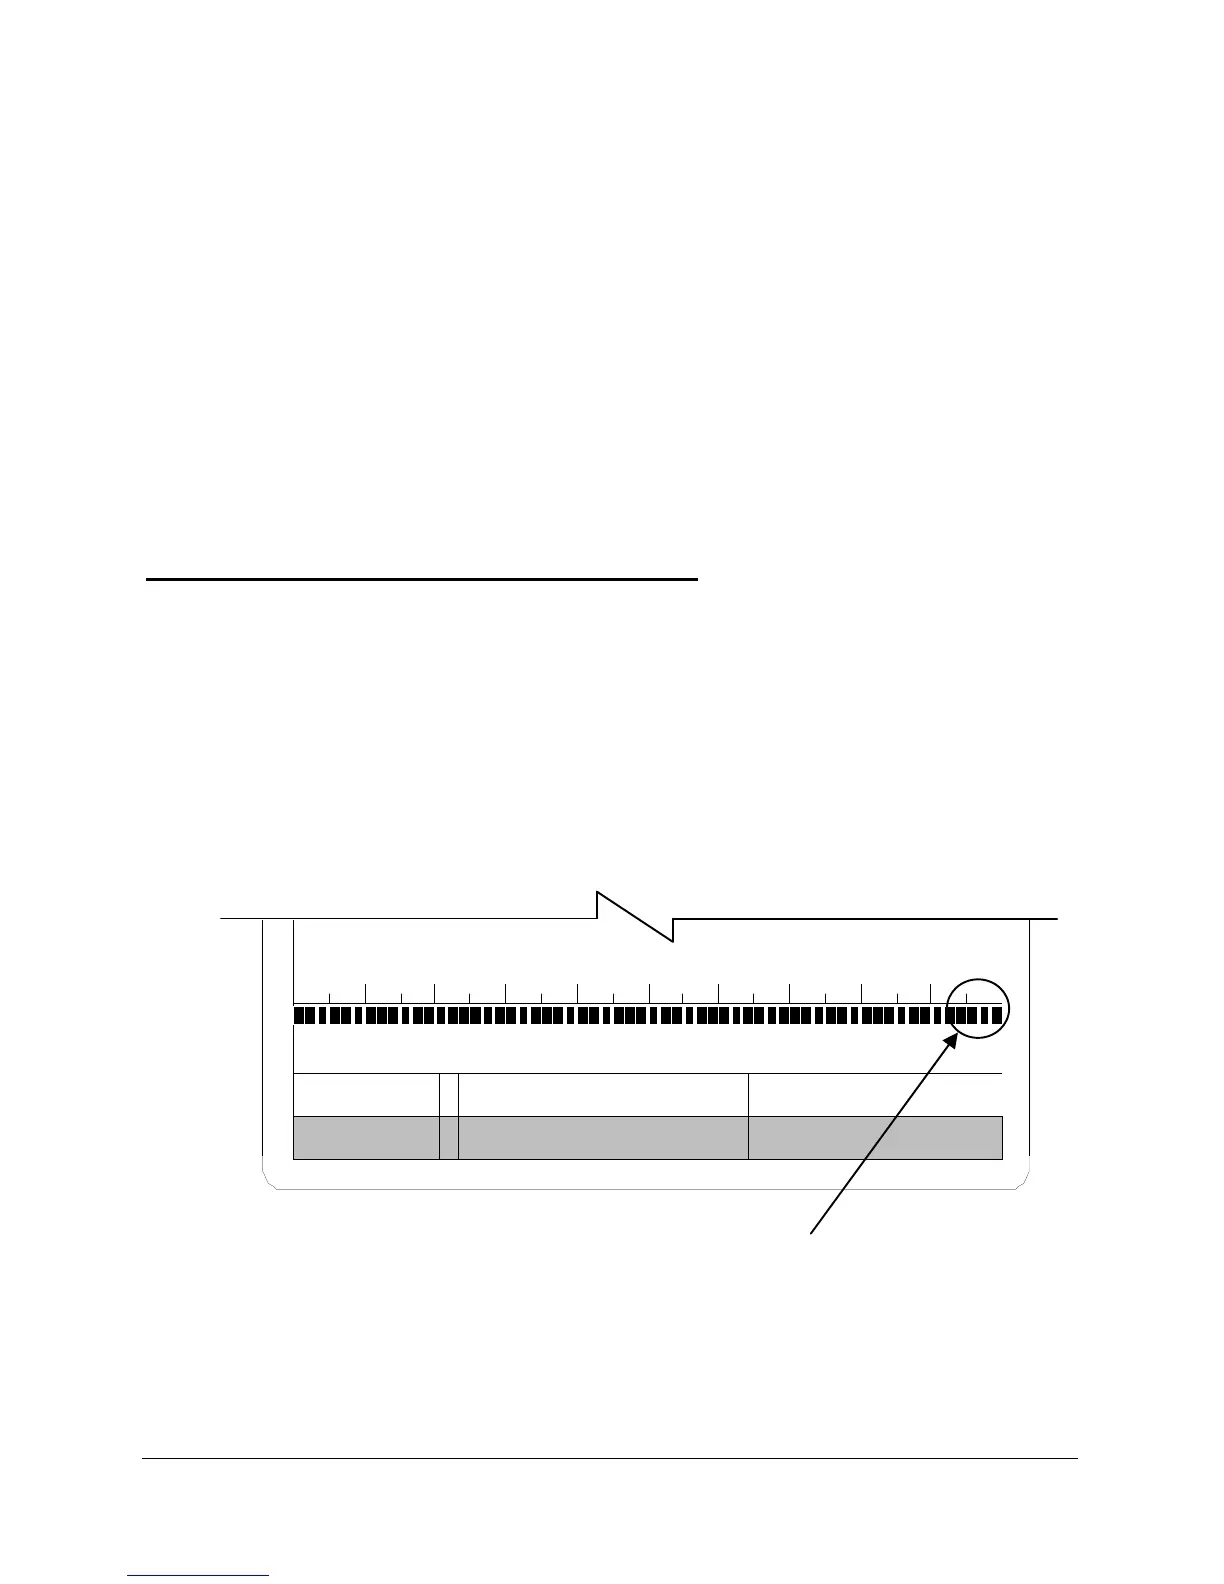
Bar Graph in Pressure Decay Mode
In fill phase, the bar graph shows the product being pressurized. Full-scale
equals preset test pressure. This is the same in the stabilize time. Figure
29. At the beginning of test time, Sprint LC changes the resolution and the
bar graph becomes a very high-resolution trend indicator. The full scale of
the bar graph is the reject level set in the test parameters. When all the
blocks in the bar graph turn off the reject level is reached and the test will
fail. Figure 30.
Figure 29
PD 3.0 FILL
Mode Test Time Status