Page 66
Bar Graph in Flow Mode
In flow mode, the bar graph’s full scale is approximately the maximum
flow tolerance set in the parameters menu. A reading near full scale means
product is flowing at or near maximum flow tolerance. A reading of near
zero on the bar graph means little or no air is flowing through the product.
Bar Graph in Burst Mode
Full scale in a burst test is the maximum burst setpoint entered in the
parameters menu. The bar graph is perhaps most effective in burst mode
because the moving bar shows the gradual pressure increase controlled by
the needle valve. Watching the bar graph can help when adjusting the flow
control needle valve for the optimal ramp rate when burst testing.
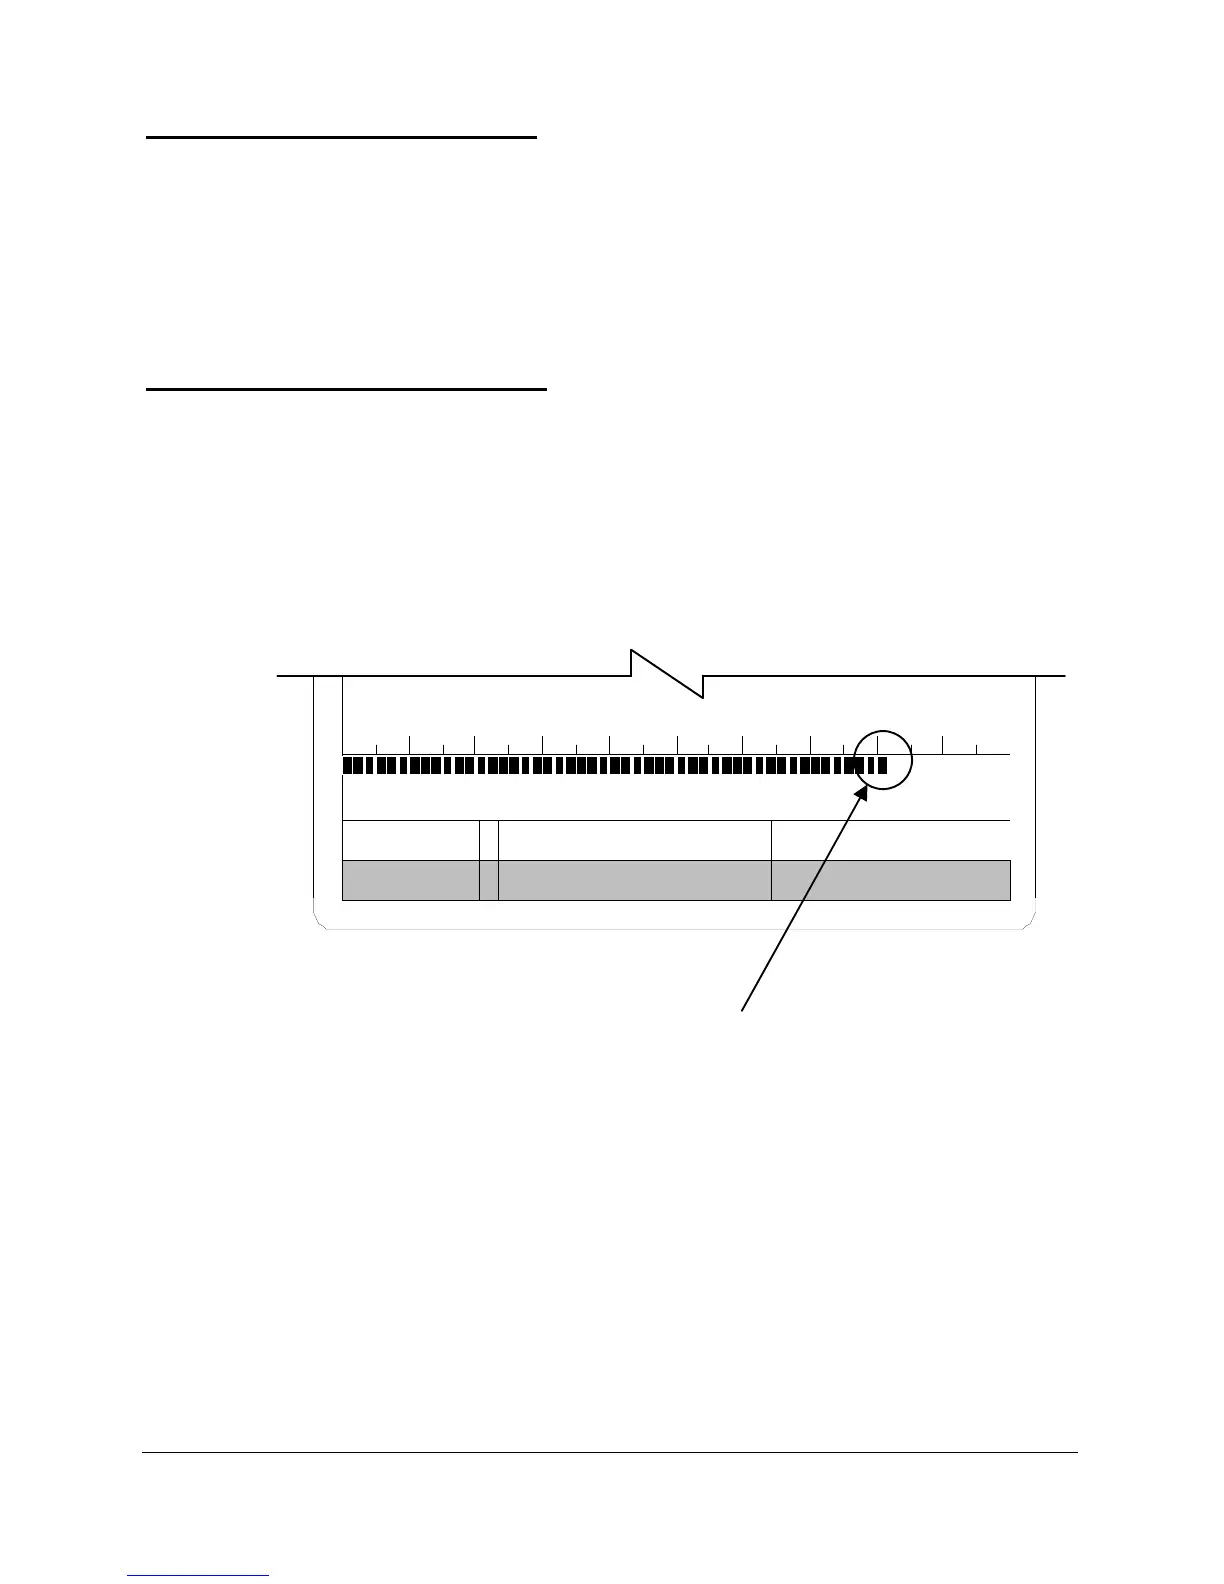
Figure 30
During the test phase of a
pressure decay test, Sprint
magnifies the scale. The
slightest leak shows up on
the bar graph as the ticks
move down (to the left).
PD 3.0 TEST
Mode Test Time Status