DME Admin Guide 183
Chapter 16
Diagnostics
Trace Capture
To access the Trace Capture diagnostic functions:
1. Navigate to
Diagnostics > Diagnostics.
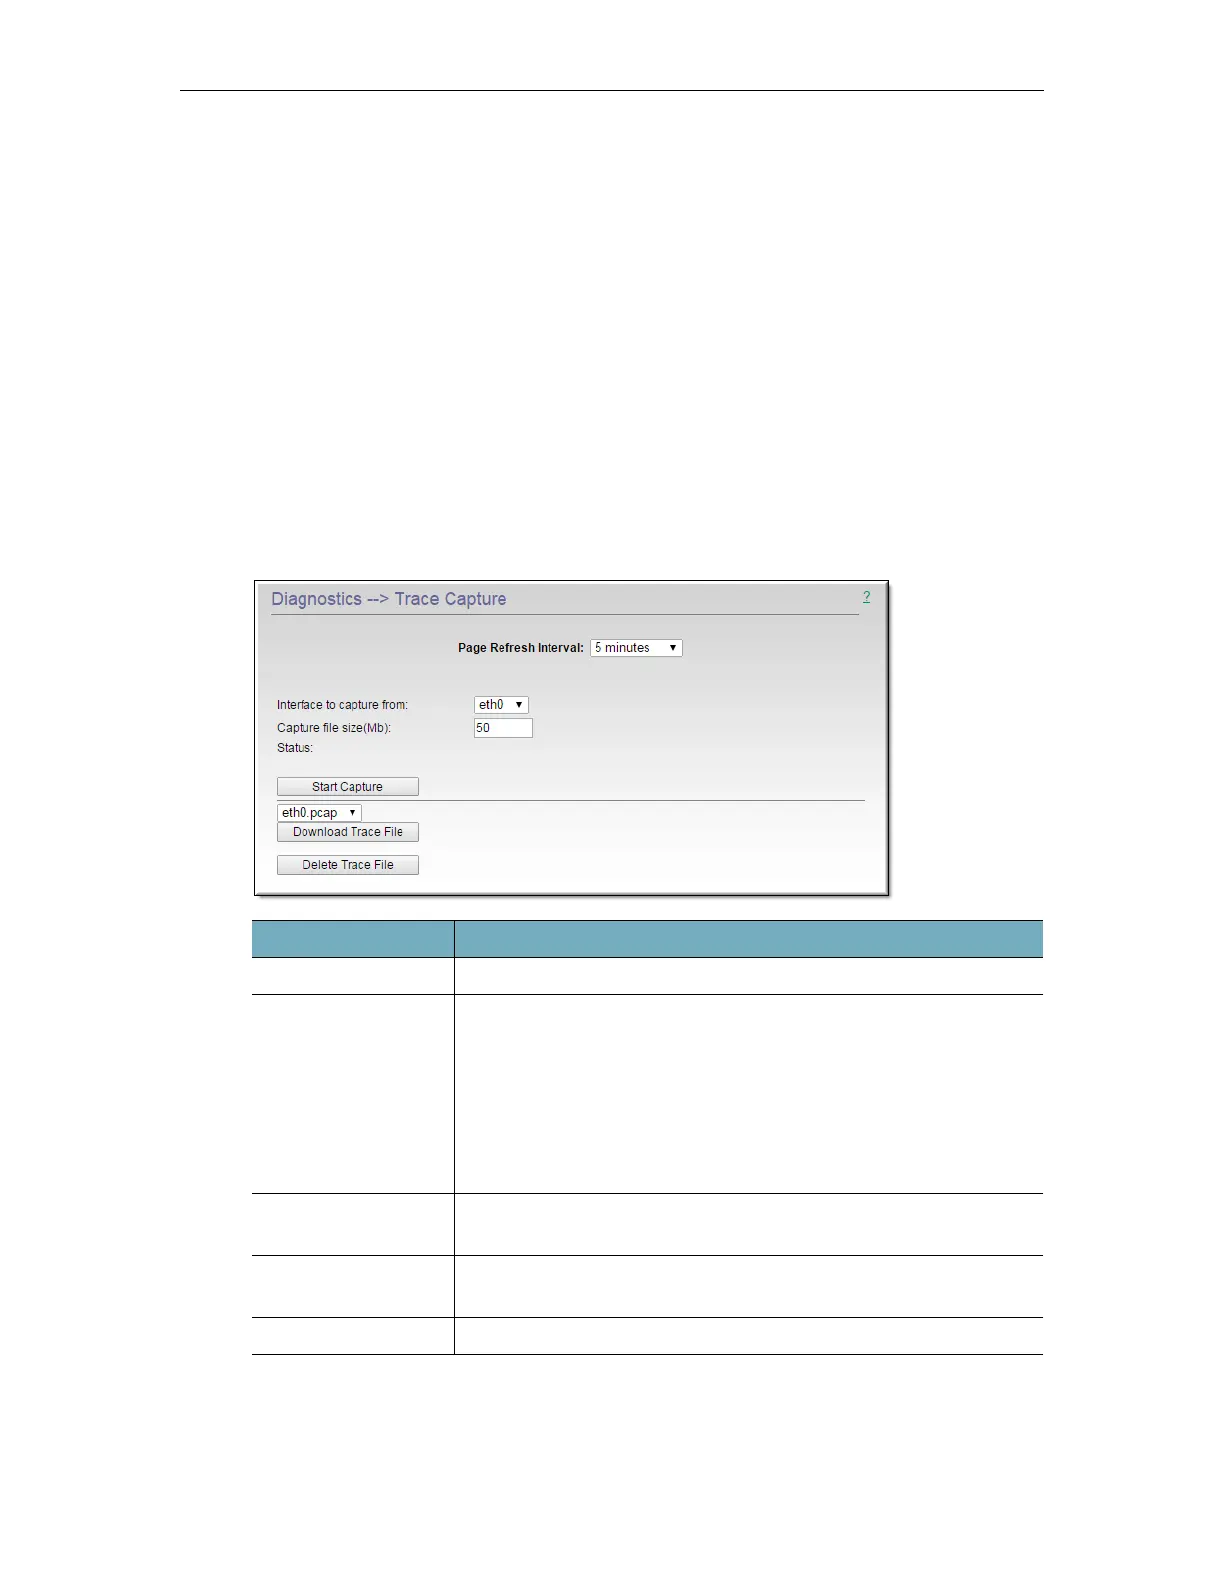
The Trace Capture utility creates a TCP dump of network traffic that can be used by Vbrick
Support Services when troubleshooting VC Gateway issues. It captures packets based on the
criteria you select and can subsequently be viewed in Wireshark or a similar application. As
explained below, you run the utility, retrieve the capture file, and send to it Vbrick.
To create a trace capture:
1. Select an interface from the dropdown.
Field Description
Page Refresh Interval Choose how often to refresh the information on the page.
Interface to capture
from
• eth0 – this is the same as bond0 if load sharing is enabled on the
IPv4 network interface.
• bond0 – captures a trace across all network interfaces that are
enabled.
• any – captures a trace for both external and internal interfaces
(bond0 and lo).
• lo – captures a trace of the local host interface (127.0.0.1) only.
Capture file size Specify the size (default = 50 MB) of the capture file. The capture
will terminate when file size reaches this value.
Status Displays
Capturing while a trace capture is in progress or blank
when finished or idle.
Start | Stop Capture Start or stop the capture process.