9 Analyzing Exam Data and Creating Reports Instructions for Use
2660021169042 Rev. A 2018-039.4 Working with Viewport Images
124 / 246 2660021169042 Rev. A 2018-03
5. To adjust the transparency of the overlay, click the trans-
parency icon (3) and move the slider up to increase trans-
parency or down to decrease transparency.
6. To close the image editing toolbar, click the X on the right.
9.4.5 Creating a Custom Slice
In the Spotlight Report, you can change the angle or length of a
slice to view.
When you create a custom slice angle, a slider appears to the right
of the fundus image. Move the slider up or down to display the
angle slices.
To create a custom slice:
Prerequisite þ Logged in to review station (or instrument): Logging In as
Operator or Data Analyst [}73]
þ The scan report or analysis is open: Opening a Report or
Analysis [}120]
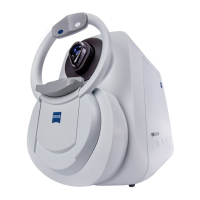
Action 1. Click the custom slice icon.
ð The draw scan tool opens.
2. Edit the direction or length of the slice.
3. Click Add to Report.
Result ü The custom slice is added to the report.
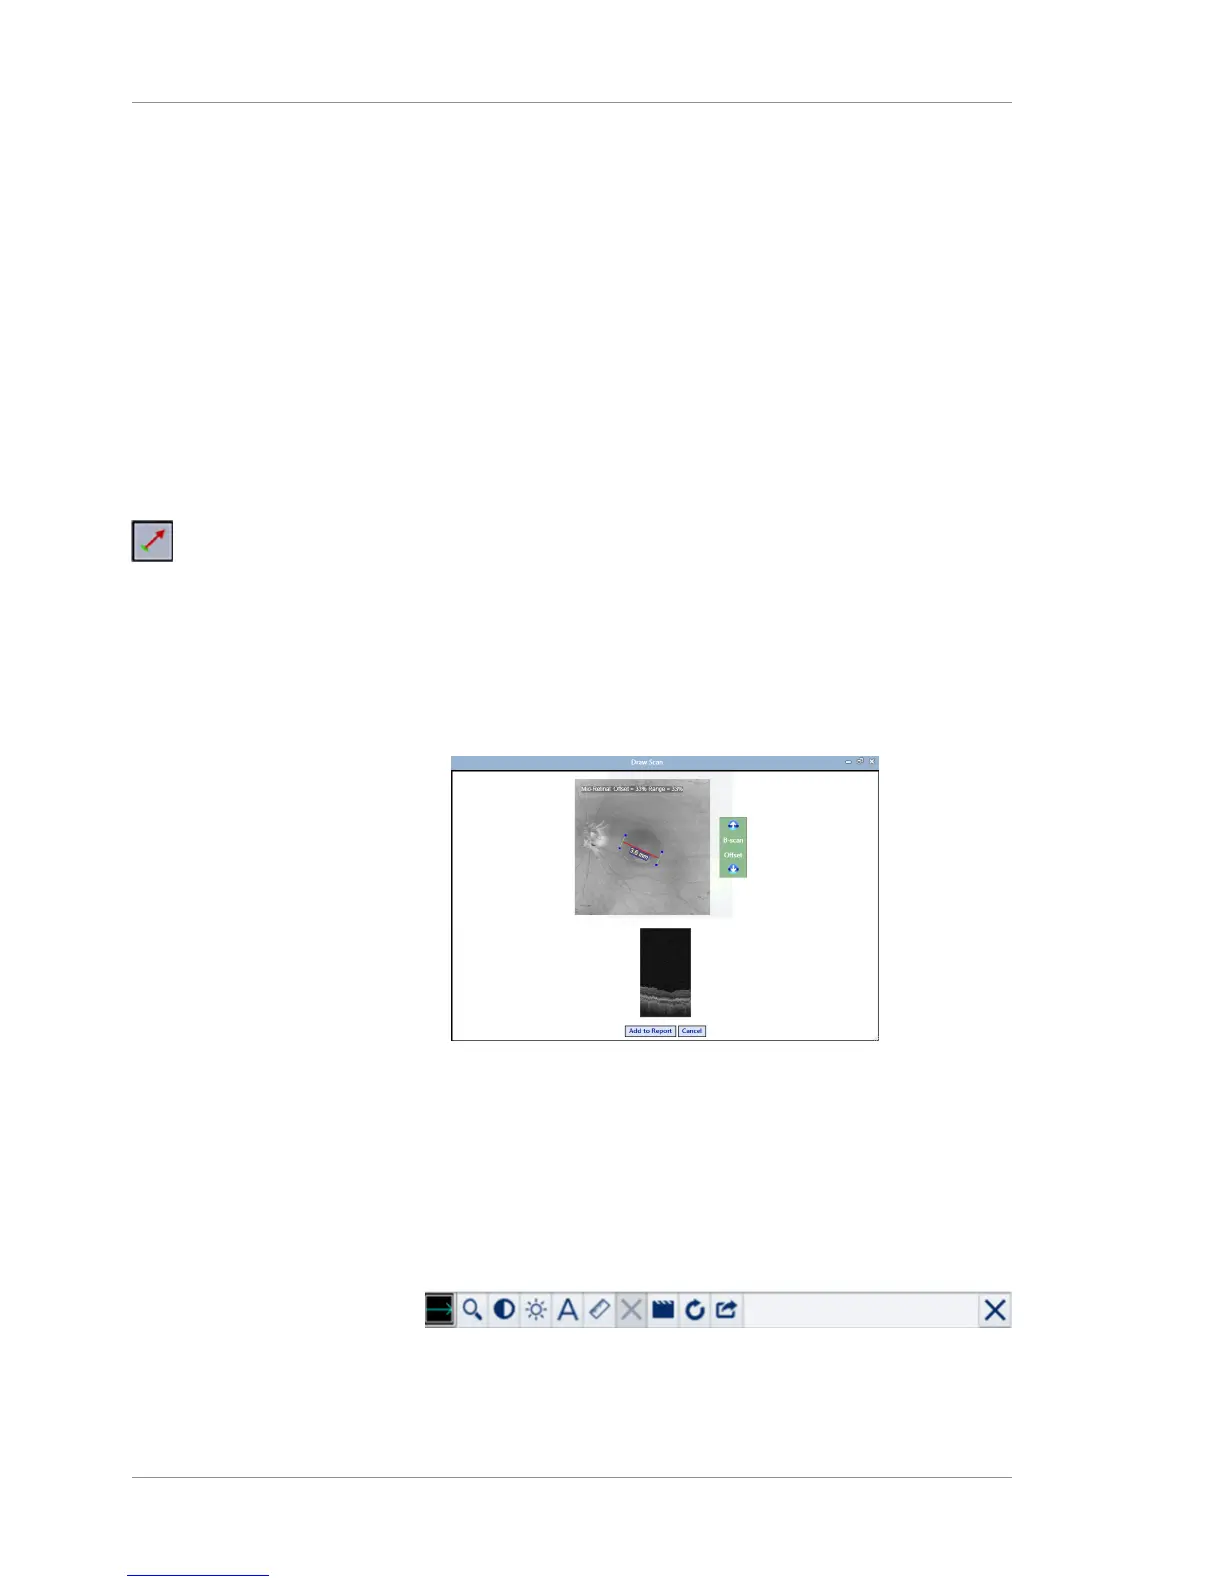
9.4.6 Editing Images
In the viewport of the Analysis and Report screens, the images, B-
scans, and overlays have a set of tools for you to adjust, edit, and
annotate them.
You can open this toolbar by clicking the upper-right corner of any
image in the viewport.