Instructions for Use 9 Analyzing Exam Data and Creating Reports
2660021169042 Rev. A 2018-03 9.9 Changing Viewport Layout
2660021169042 Rev. A 2018-03 153 / 246
ð The new segmentation location blends with the automatic
segmentation and appears continuous.
5. Select the bottom layer to edit under the red line, adjust the
red line to the new layer location, and click Auto Propagate.
ð The new segmentation location blends with the automatic
segmentation and appears continuous..
6. To reset either layer, click the reset icon.
7. To automatically calulate the layer, click Auto Calculate.
8. To turn on the RNFL thickness map, slide RNFL Thickness
Map to on.
9. To turn off the RNFL thickness map, slide RNFL Thickness
Map to off.
10. Click Save.
9.9 Changing Viewport Layout
To change the viewport layout:
Prerequisite þ Logged in to review station (or instrument): Logging In as
Operator or Data Analyst [}73]
þ The scan report or analysis is open: Opening a Report or
Analysis [}120]
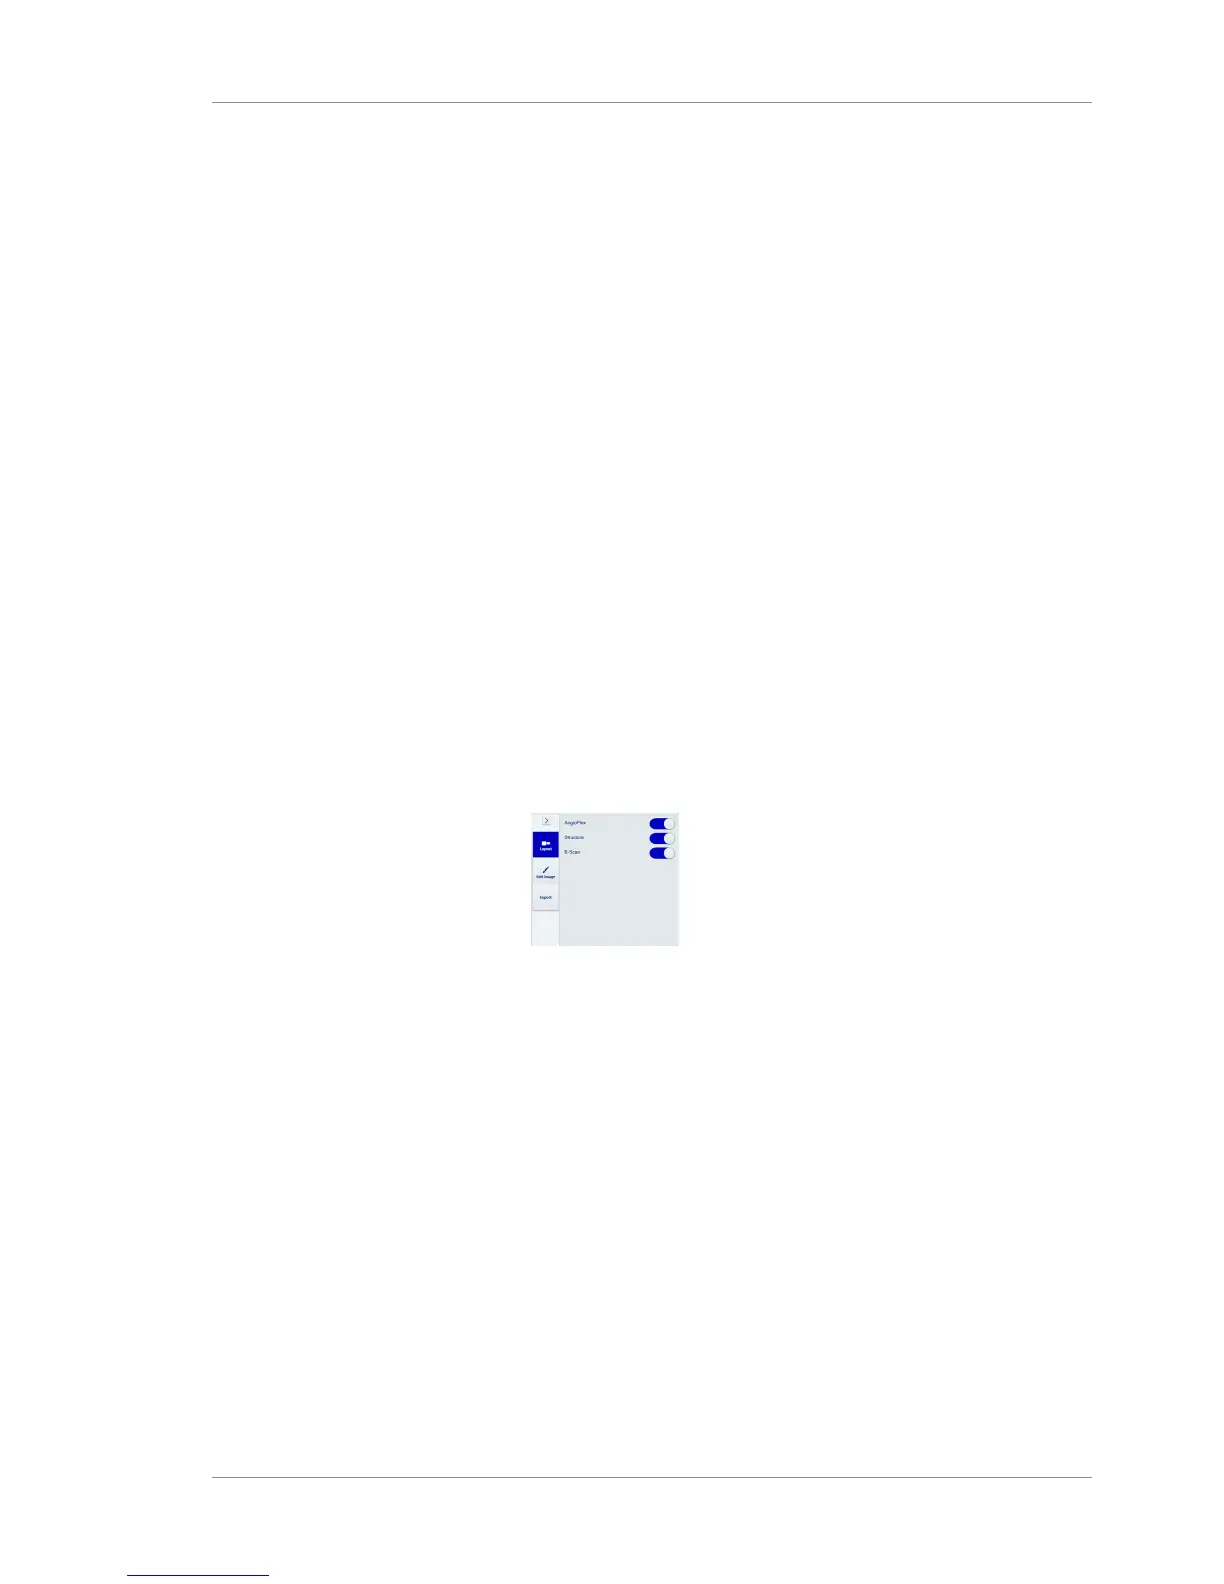
Action 1. Select the Layout options.
2. To show the AngioPlex image, slide AngioPlex on.
3. To hide the AngioPlex image, slide AngioPlex off.
4. To show the structure image, slide Structure on.
5. To hide the structure image, slide Structure off.
6. To show the B-scan image, slide B-Scan on.
7. To hide the B-scan image, slide StruB-Scancture off.
9.10 Exporting a Report or Analysis
To export a report or analysis:
Prerequisite þ Logged in to review station (or instrument): Logging In as
Operator or Data Analyst [}73]
þ The scan report or analysis is open: Opening a Report or
Analysis [}120]
Action 1. Select the Export option.
 Loading...