106 N9912A FieldFox User’s Guide
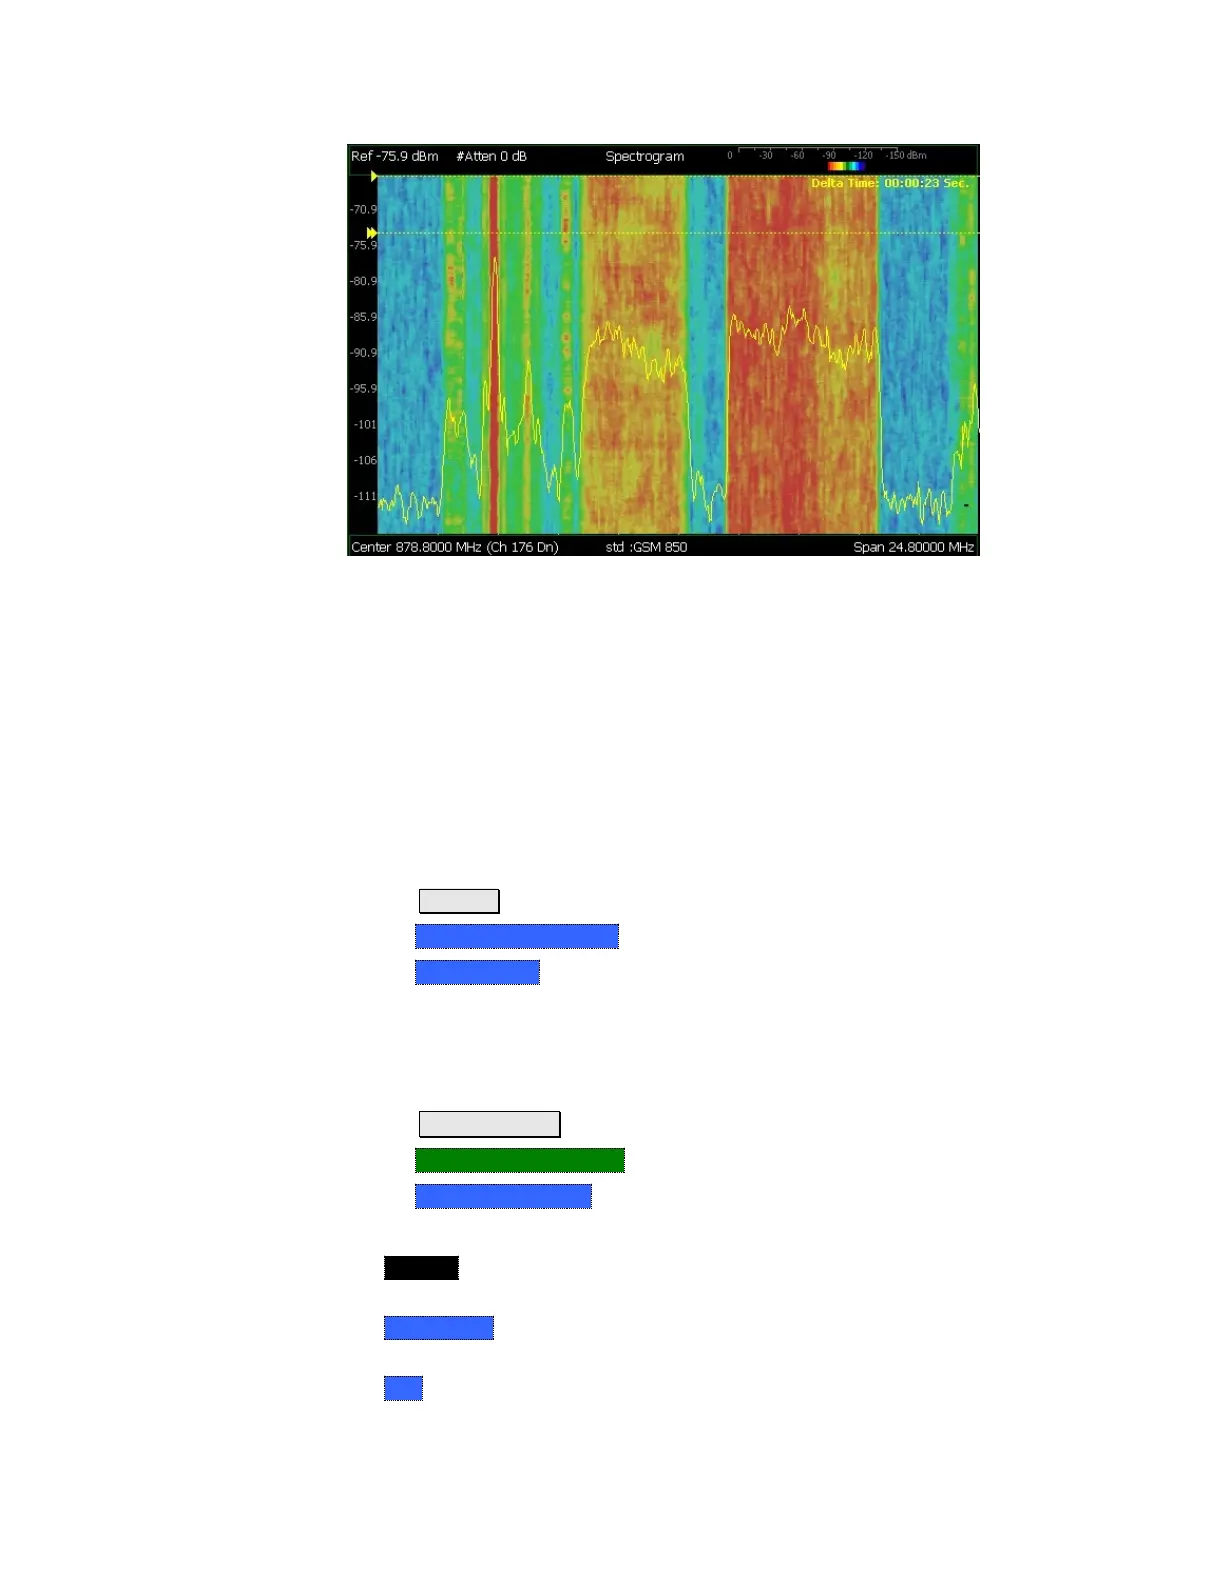
Spectrogram display- Overlay view- with time markers 23 seconds apart.
The following settings all contribute to the sweep time of an individual trace, and
therefore, the total elapsed time that can appear on the screen in Spectrogram
display:
Frequency Range. Learn more on page 70.
Resolution BW and Video BW. Learn more on page 80
Sweep Time (Acquisition). Learn more on page 84.
Resolution (Number of Points). Learn more on page 89.
How to select Spectrogram
Press Meas 1
Then Interference Analysis
Then Spectrogram
How to modify the Spectrogram
You can change how the spectrogram is displayed relative to the data trace. This
setting affects the total number of trace records that can be displayed.
Press Meas Setup 4.
Then Spectrogram Settings
Then Spectrogram View
Then choose from the following:
o Overlay Displays the data trace over the spectrogram with NO graticules.
Total trace records: 340.
o Full Screen Displays the spectrogram with NO data trace. Total trace
records: 340.
o Top Displays the data trace above the spectrogram. Total trace records: 130.
 Loading...