Basic Functions
9836 3521 01 73
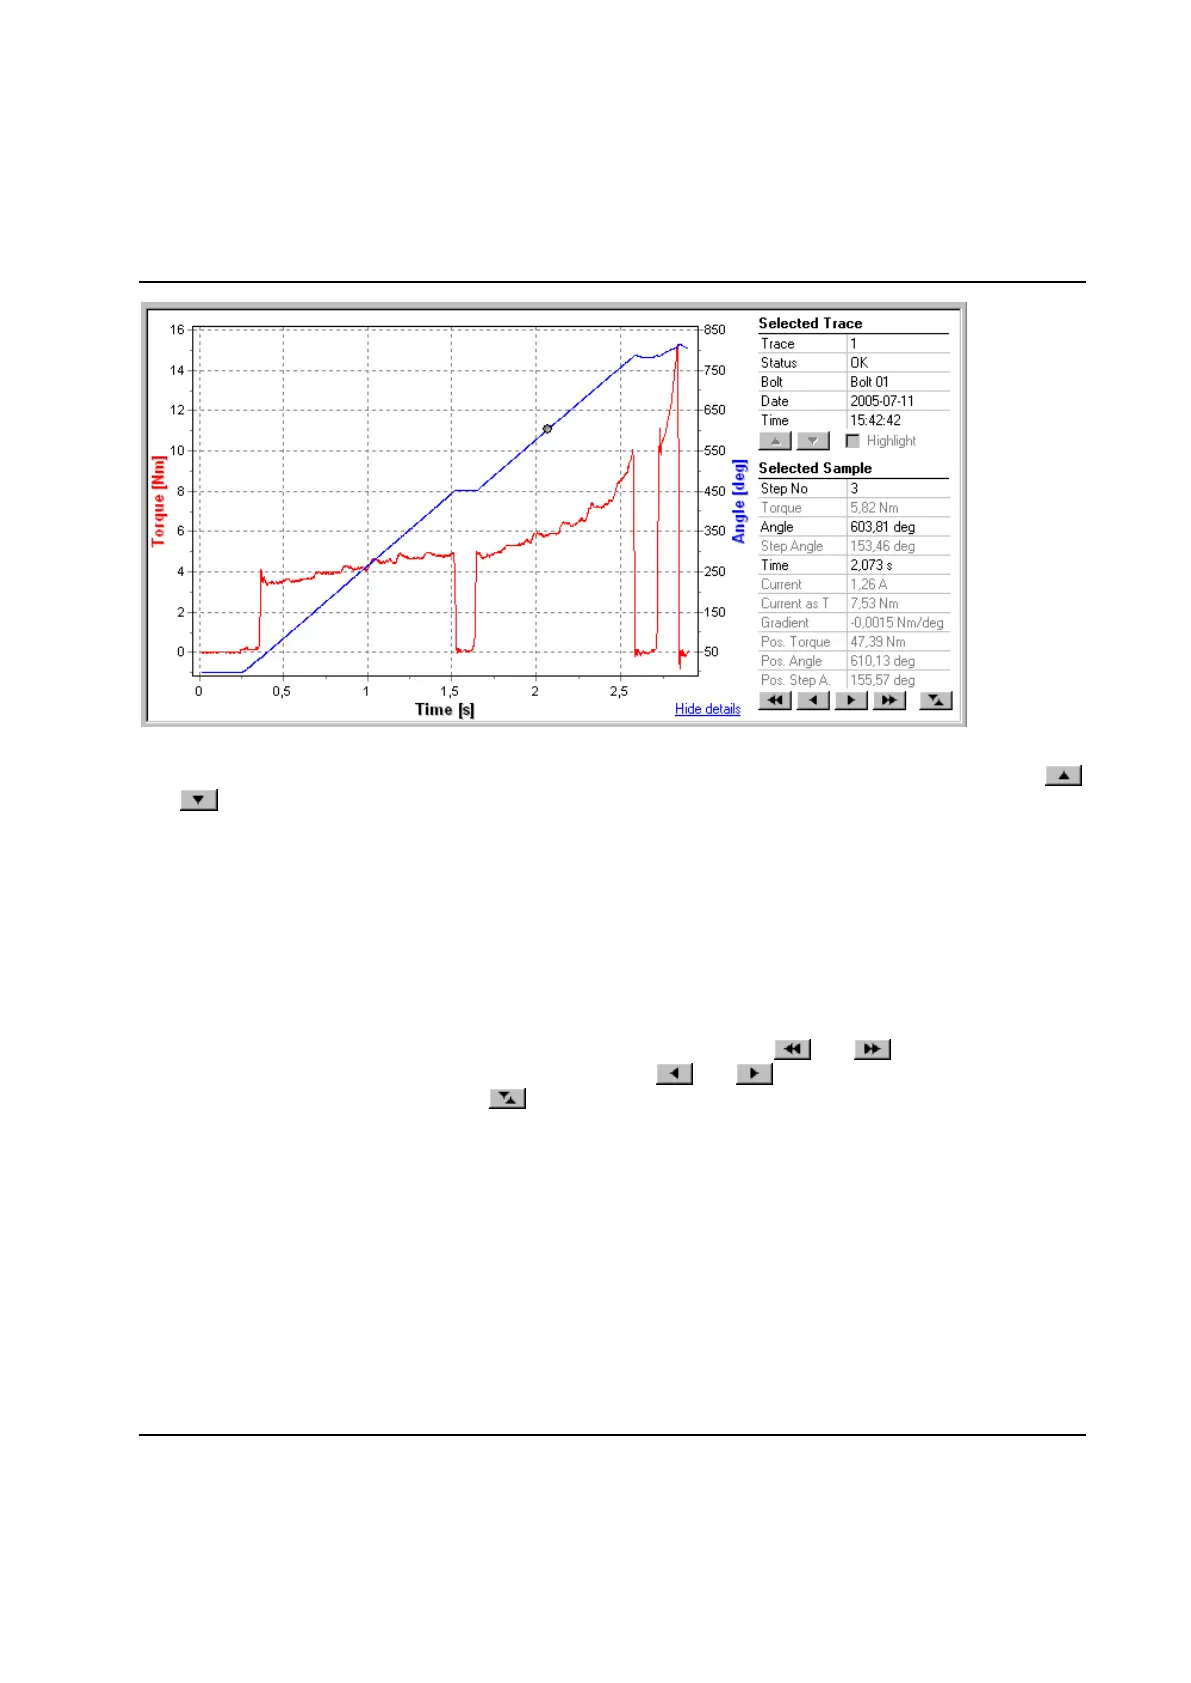
Under the heading Selected Trace, information about the currently selected trace is displayed. When
several traces are displayed (using the Select option to open traces from TC) you can use the buttons
and to browse through all traces. Note that two curves can be displayed for each trace.
In the identity list (displayed by clicking on the button Identity>>) more information can be found for the
trace.
Under the heading Selected Sample, information about the currently selected sample is displayed. To
select a sample, click with the mouse on the graph. The point on a curve that is nearest to the mouse
pointer is selected and marked with a black dot.
The information that belongs to the actual curve is displayed with black text. Other information about the
selected sample is displayed with gray text.
Use the buttons to fine tune which sample that is selected. The buttons and moves the point 10
samples backwards or forwards in the buffer. The buttons and moves the point only 1 sample
backwards or forwards. Use the button to toggle between the two quantity curves for the trace. In the
picture above, clicking on this button would move the selected point from the Angle over Time curve to
the Torque over time curve.
Use the checkbox Highlight if you want to study one specific trace among all the others.
 Loading...