Chapter 2: Software Windows and Toolbars 35
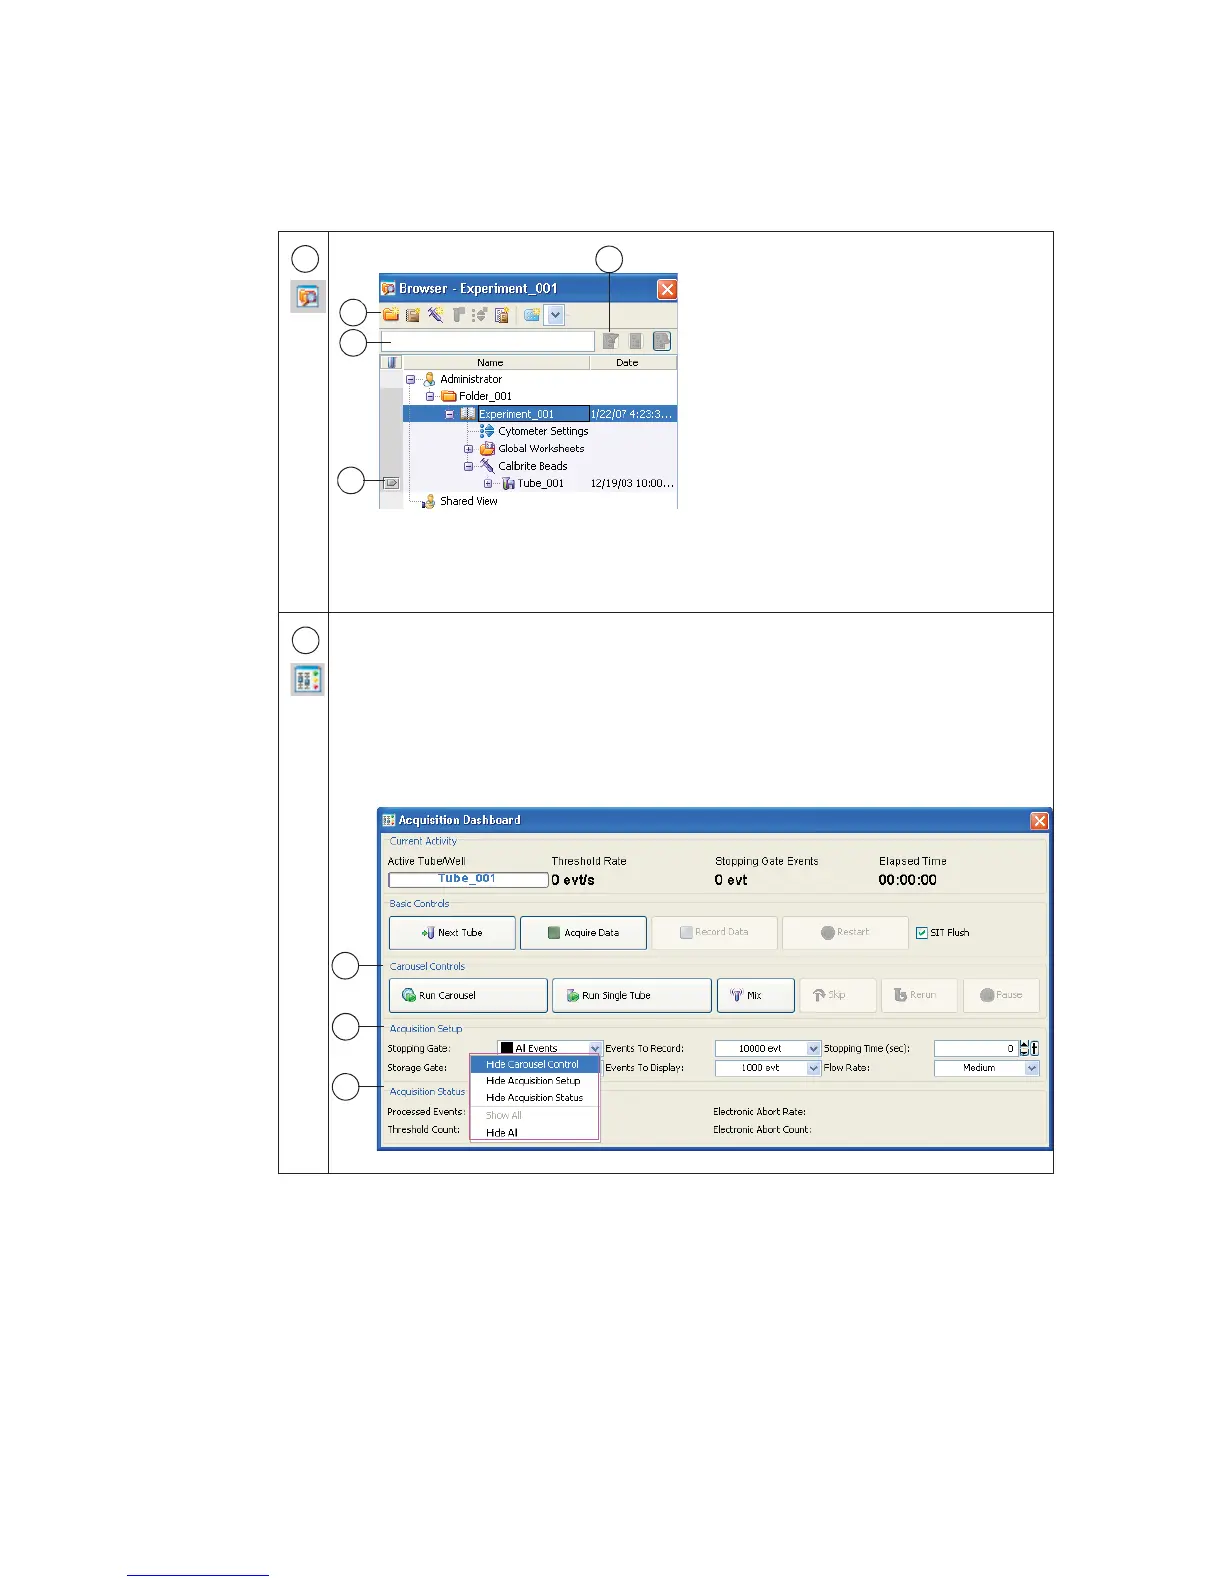
The Browser lists folders, experiments,
and experimental elements in a
hierarchical view, provides an interface
for setting up experiments, and contains
a current tube pointer (c) indicating the
tube for which acquisition or analysis
data will be shown.
Only one experiment can be open at a
time. In an open experiment, you can
add, rename, or copy elements, and
record or display data.
Click a button in the Browser toolbar (a) to add elements to the Browser. To
display a particular experiment, enter a term in the search field (b) and click the
Find button (d).
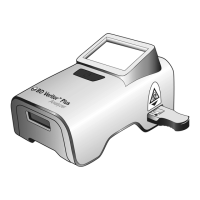
The Acquisition Dashboard contains controls for setting up, starting, monitoring
data acquisition and recording, and running the Loader. Basic controls are always
shown. Carousel Controls (e), Acquisition Setup (f), and Acquisition Status (g) can
be hidden or shown by right-clicking anywhere on the Dashboard (except buttons
and fields or in Basic Controls) to display the Show/Hide menu and making your
selection. You can resize the Dashboard by dragging an edge or corner of the
window.
2
a
c
b
d
3
e
g
f