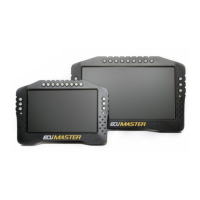
Another pane type is the Graph log. The Graph log displays values over time.
The following menu appears after right clicking on the log area:
Here you can add a new log channel (Add), remove an existing log channel
(Remove Graph), change a log channel (Change), or relocate a channel
(Move Up, Move Down). You may also change the log frequency (Set log
frequency) and change the display settings for a given channel
(Properties).
Just like the main desktop of the application, the log pane has tabs that are used for displaying
different log channel groups (e.g. engine, track, etc.). These tabs work exactly the same way as
the main desktop tabs.
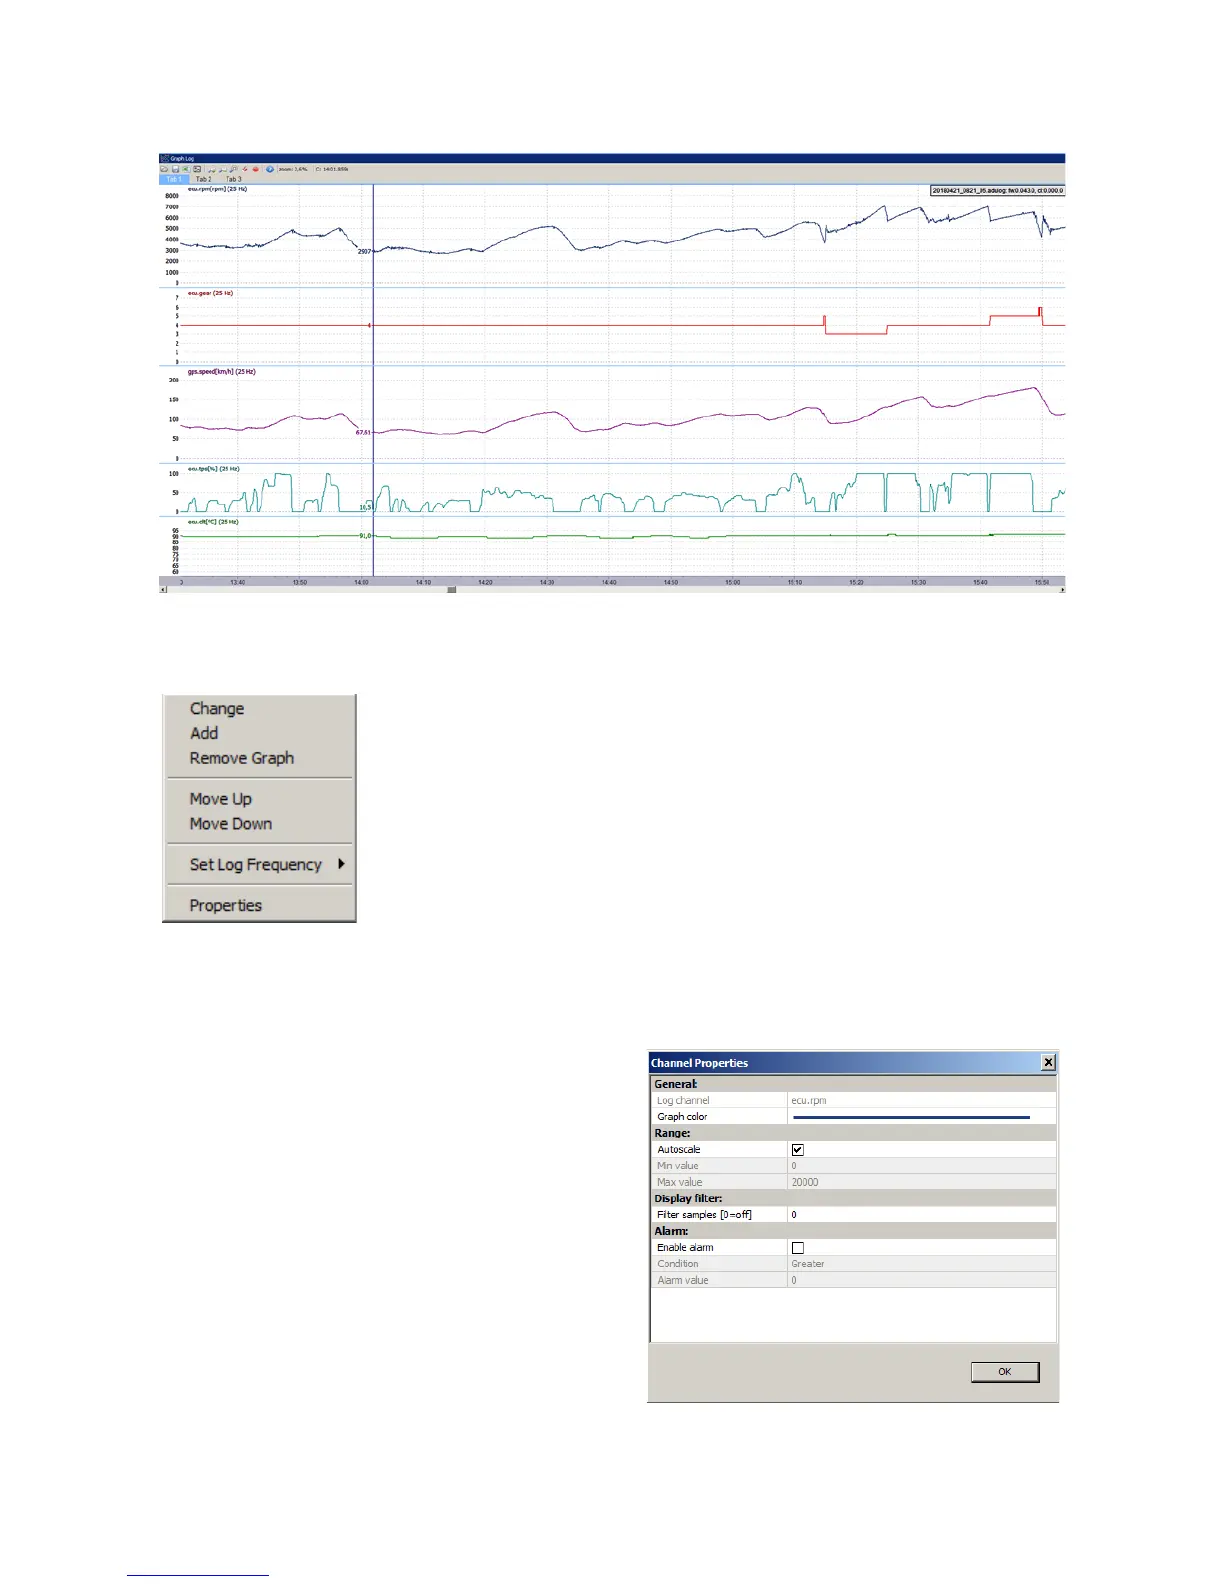
To alter settings for a logged channel, right click on
the channel name and click 'Properties'. In this
meny you may choose the colour (Graph Colour)
and the range of values for the channel (Min. and
max. value). The Autoscale option performs an
automatic calculation of the display range based on
logged data. In this menu you may also enable the
Filter samples option, which defines the number of
data samples that will be averaged to generate the
displayed value. The 0 value means no filtering.
Page 32/137