6. Diagnostics and optimization
6−45
Festo P.BE−SPC200−WIN−PISA−CD−EN en 0901d
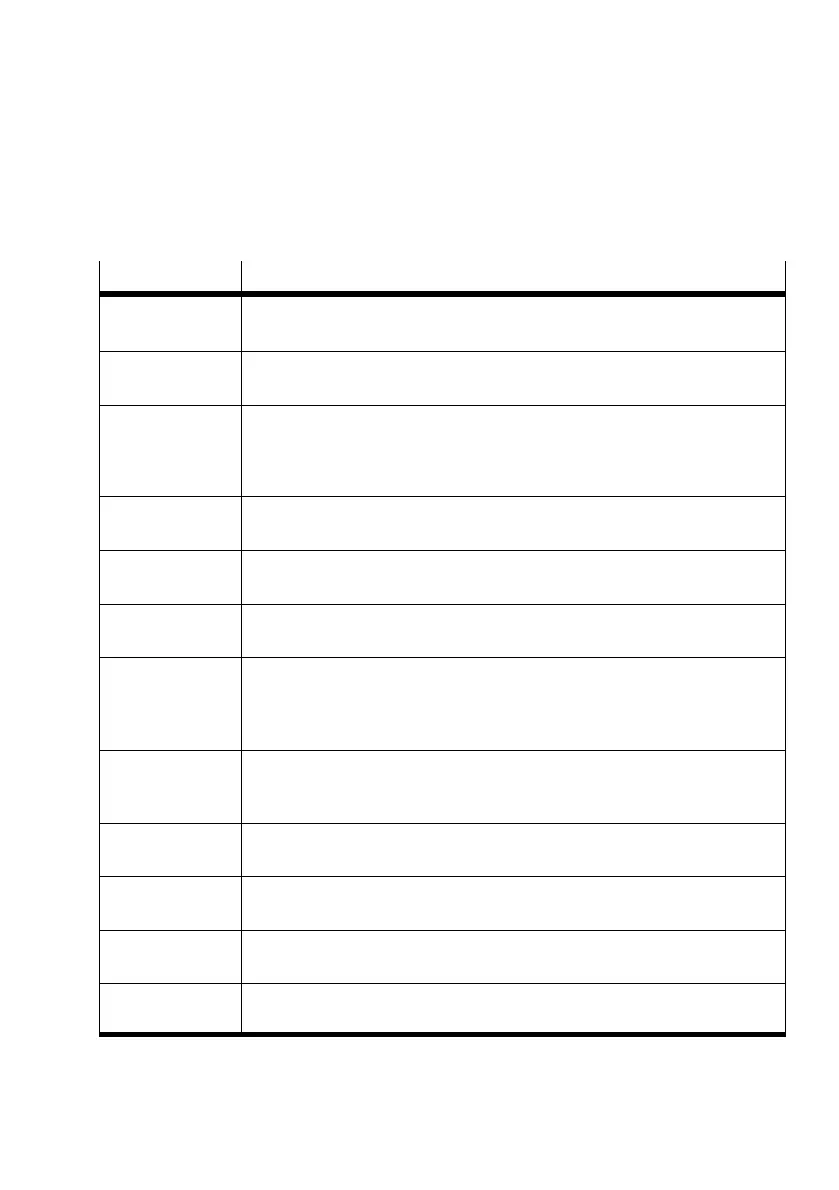
Explanation of the graphic window elements:
Element
Explanation
Graphic title You can read the number of the graphic window in the title line as well as the
title of the graph in the case of user−defined graphics.
Display area The curves recorded are displayed in this area using the measurement values
determined.
Co−ordinate
display
The cursor co−ordinates are displayed in the header line. If the Data cursor"
option is activated, the values displayed will refer to the position of the data
cursor, i.e. the co−ordinates of the measurement values determined. The
display is relative to the reference cursor specified if a reference cursor is set.
Curve 1 A graph always contains at least one curve using the scale of the first ordinate
axis (y1 axis).
Curve 2 You can display a second measurement variable with its own scale by assigning
this to the second ordinate axis (y2 axis).
Further curves You can allocate further curves to both ordinates in addition to the first two
curves.
Data cursor If you activate the display of a data cursor, the co−ordinates displayed will
relate to the co−ordinate cross additionally displayed, i.e. the data cursor. This
cursor always lies exactly on the measurement point closest to the mouse
pointer.
Reference cursor The current position can be determined as the reference cursor when the data
cursor is activated. The co−ordinate display is then relative to the reference
cursor specified.
X−axis The abscissa (or x−axis) of the graph is usually the time axis. The abscissa can
also be assigned with any other measurement variable.
y1−Achse The first ordinate axis (or y1−axis) is scaled with the unit of the first measured
row under 1. y−axis" in the dialogue window Data basis".
y2−Achse The second ordinate axis (or y2−axis) is scaled with the unit of the first
measured row under 2. y−axis" in the dialogue window Data basis".
Legend Names, colours, line attributes and the data point symbol for the relevant curve
shown are represented in the legend.Legend











 To Next Page