97
EN-US
Display values in
the ‘Day / Year /
Total’ display
modes
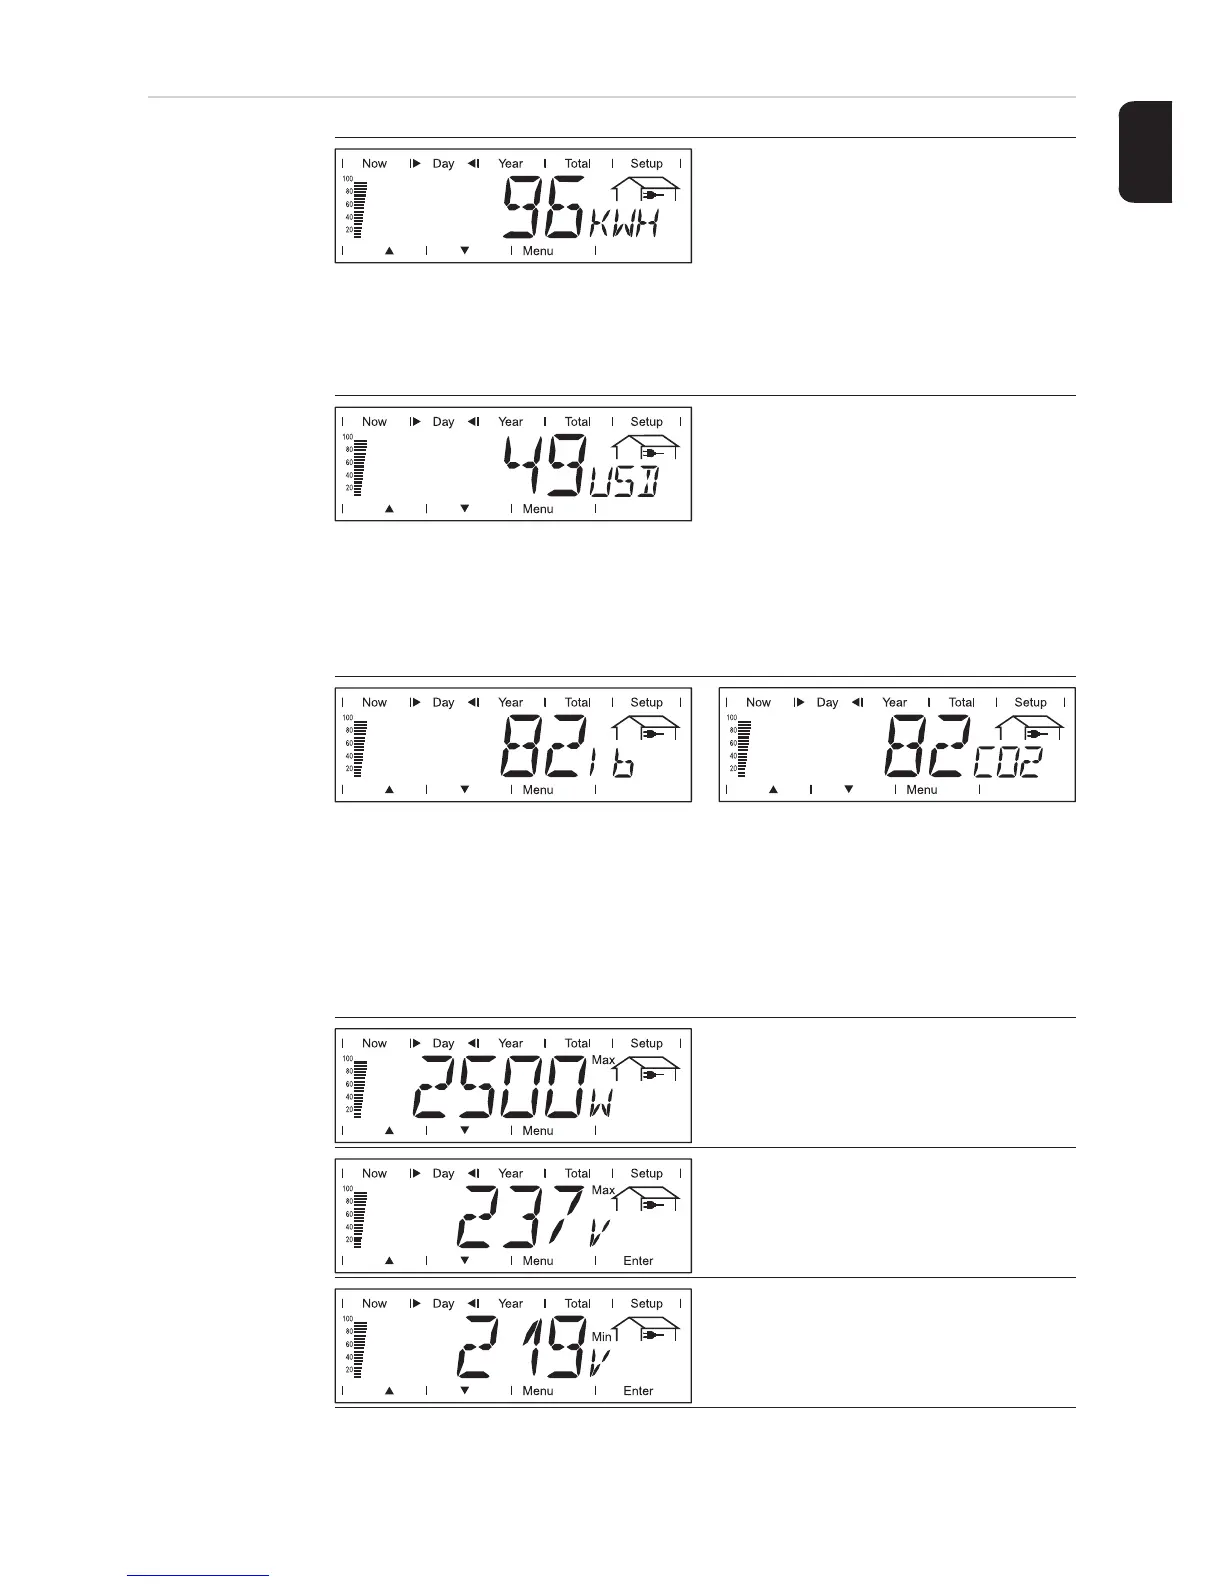
Output energy
Energy supplied during the monitored pe-
riod (kWh / MWh)
Due to the variety of different monitoring systems, there can be deviations between the
readings of other metering instruments as compared to the readings from the inverter. For
determining the energy supplied to the grid, only the readings of the calibrated meter sup-
plied by the electric utility company are relevant.
Yield
Money earned during the monitored peri-
od (set currency and price per kWh in set-
up menu)
As was the case for the output energy, readings may differ from those of other instru-
ments.
‘The Setup Menu’ section describes how to set the currency and rate for the energy sup-
plied. The factory setting depends on the respective country-specific setting.
CO2 reduction
CO2 emissions saved during the monitored period
(lb or T; pounds or tons)
The area for unit display switches between ‘lb’ or ‘T’ and ‘CO2.’
The CO2 meter gives an indication of CO2 emissions that would be released during the
generation of the same amount of electricity in a combustion power plant.
This factory setting for this is 1.3 lb/kWh.
Maximum output power
Highest output power during the observa-
tion period (watts)
Maximum grid voltage
Highest reading of grid voltage (V) during
the observation period
Minimum grid voltage
Lowest reading of grid voltage (V) during
the observation period
 Loading...