11 - 8 WiNG 5.5 Access Point System Reference Guide
The Real Time NETCONF Messages area lists an XML representation of any message generated by the system. The
main display area of the screen is updated in real time.
Refer to the Request Response and Time Taken fields on the bottom of the screen to assess the time taken to receive
and respond to requests. The time is displayed in microseconds.
Use the Clear button to clear the contents of the Real Time NETCONF Messages area. Use the Find parameter and the
Next button to search for message variables in the Real Time NETCONF Messages area.
11.3.1.1 Schema Browser
Advanced
Use the schema browser to navigate through the WiNG schema.
To review device debugging information:
1. Select Diagnostics.
2. Select Advanced to display the UI Debugging menu options.
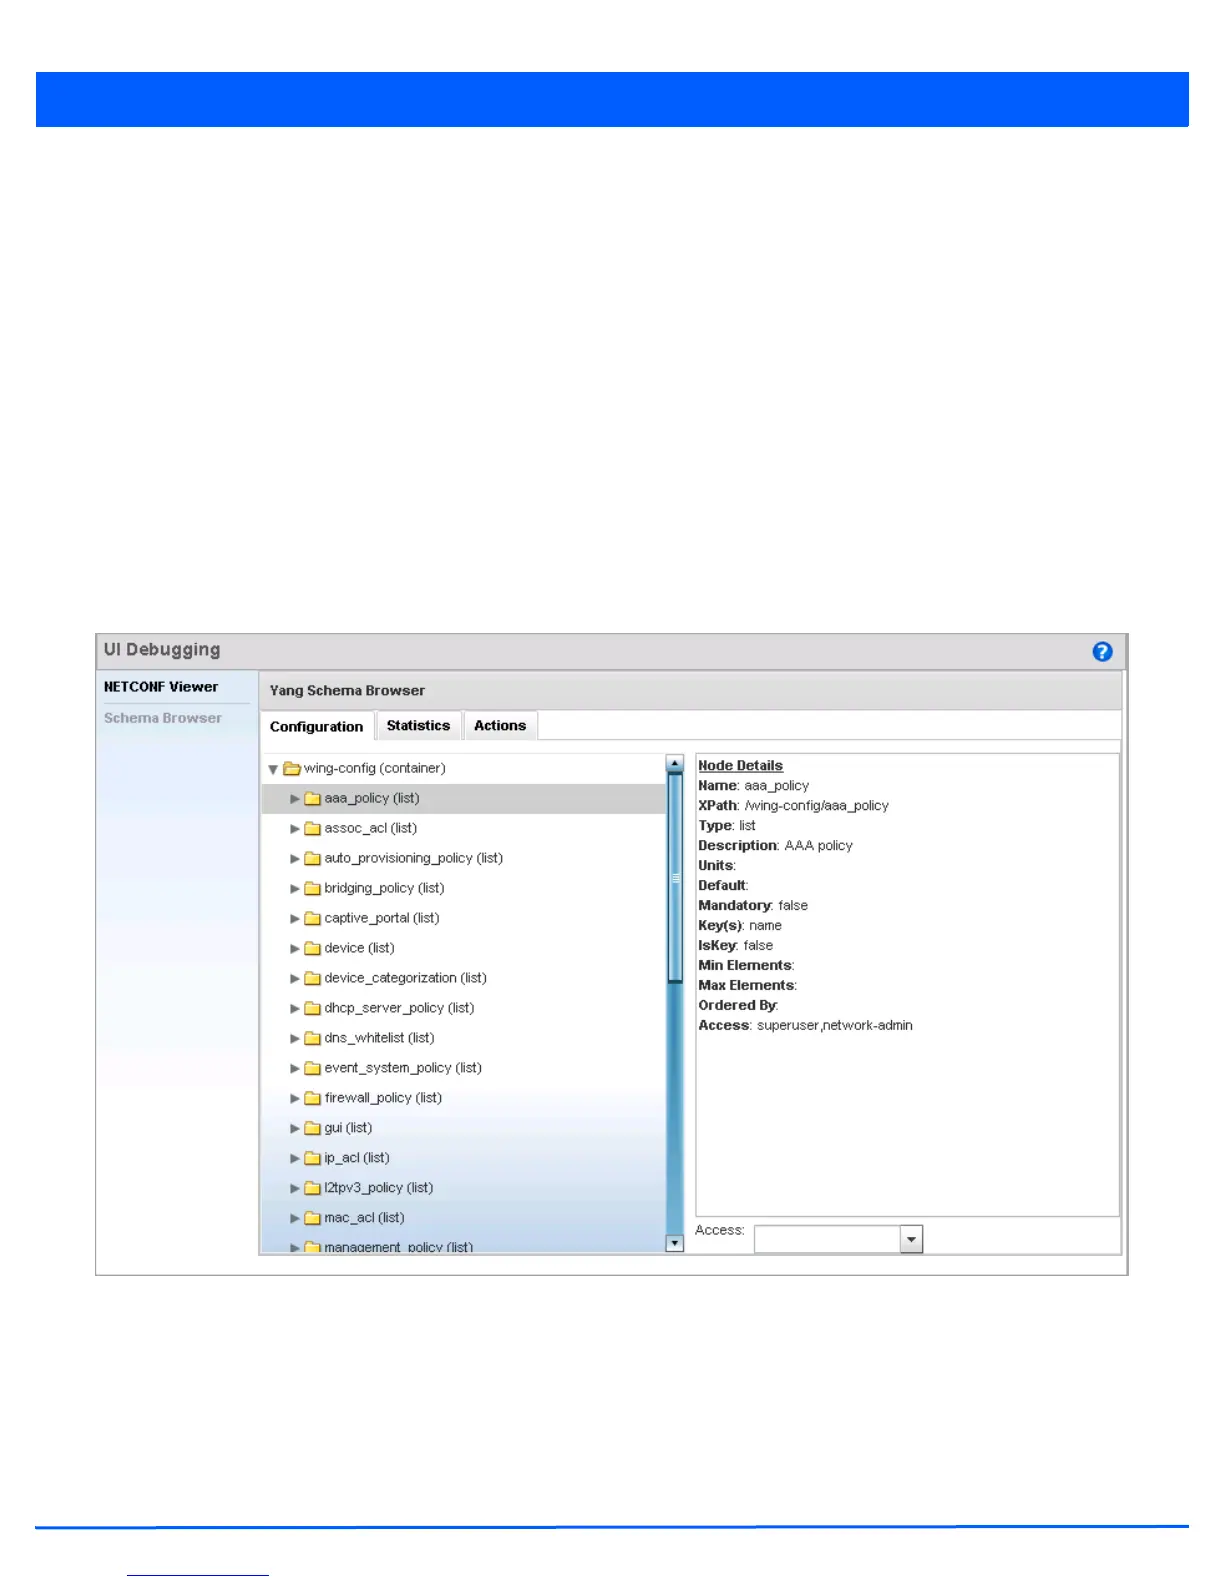
3. Select Schema Browser from the navigation pane on the left. The following screen displays:
Figure 11-6 UI Debugging screen - Schema Browser
The Scheme Browser displays the Configuration tab by default.The Schema Browser displays two fields (regardless of
the Configuration, Statistics or Actions tab selected). Use the left field to navigate the schema by expanding and collapsing
directories. Selecting a a node on the left displays node details on the right. The Schema Browser does not display
information in real time. It only displays the data on the device when last updated.
4. Expand a configuration parameter to review its settings. The Configuration tab provides an ideal place to verify if the last
saved configuration differs from default settings, or has been erroneously changed in respect to the access point’s intended
configuration.
 Loading...