13 - 150 WiNG 5.5 Access Point System Reference Guide
4. Select Refresh to update the screen to it’s latest values.
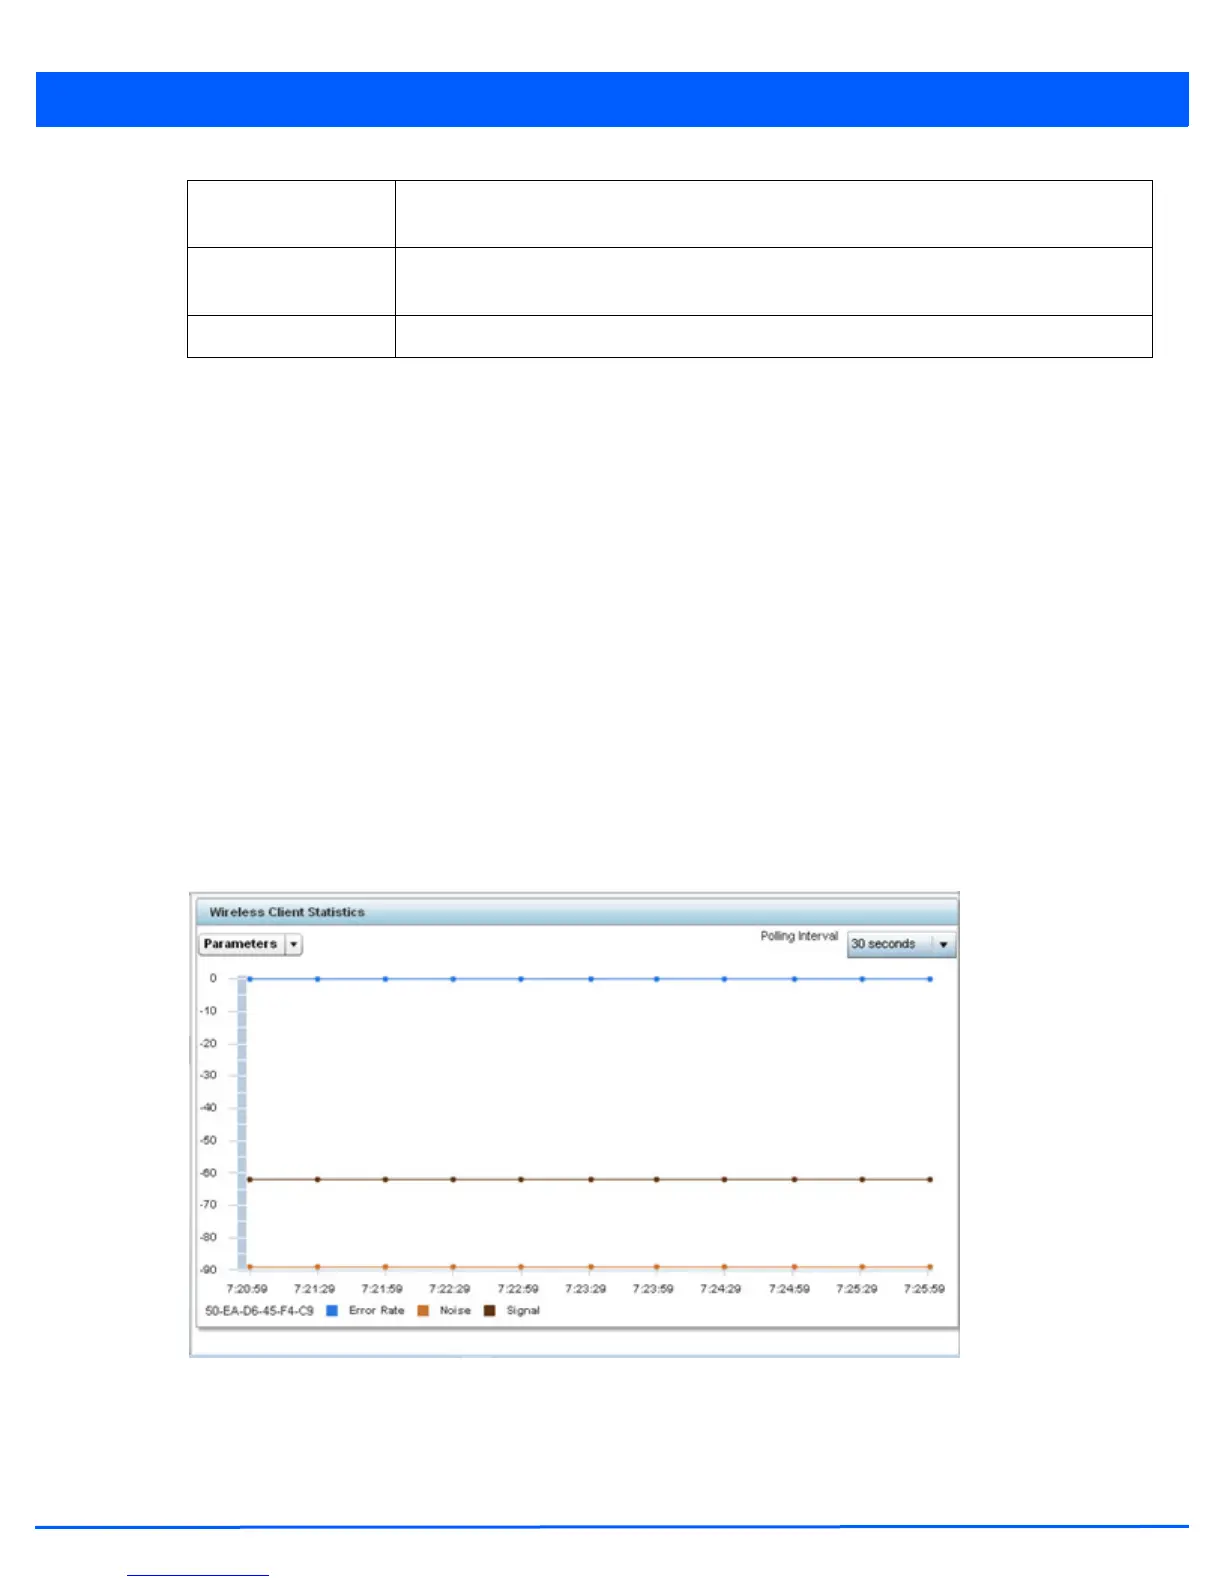
13.4.6 Graph
Wireless Client Statistics
Use the client Graph to assess a connected client’s radio performance and diagnose performance issues that may be
negatively impacting performance. Up to three selected performance variables can be charted at one time. The graph uses a
Y-axis and a X-axis to associate selected parameters with their performance measure.
To view a graph of this client’s statistics:
1. Select the Statistics menu from the Web UI.
2. Select System from the navigation pane (on the left-hand side of the screen). Expand a RF Domain, an access point then a
connected client.
3. Select Graph.
4. Use the Parameters drop down menu to define from 1- 3 variables assessing client signal noise, transmit or receive values.
5. Use the Polling Interval drop-down menu to define the interval the chart is updated. Options include 30 seconds, 1 minute,
5 minutes, 20 minutes or 1 hour. 30 seconds is the default value.
Figure 13-100 Wireless Client - Graph
Select an available point in the graph to list the selected performance parameter, and display that parameter’s value and a
time stamp of when it occurred.
Channel Lists the channel shared by both the access point and client for interoperation, and to avoid
congestion with adjacent channel traffic.
Band Lists the 2.4 or 5GHz radio band this clients and its connect access point are using for transmit
and receive operations.
Time Lists the historical connection time between each listed access point and this client.
 Loading...