Statistics 13 - 3
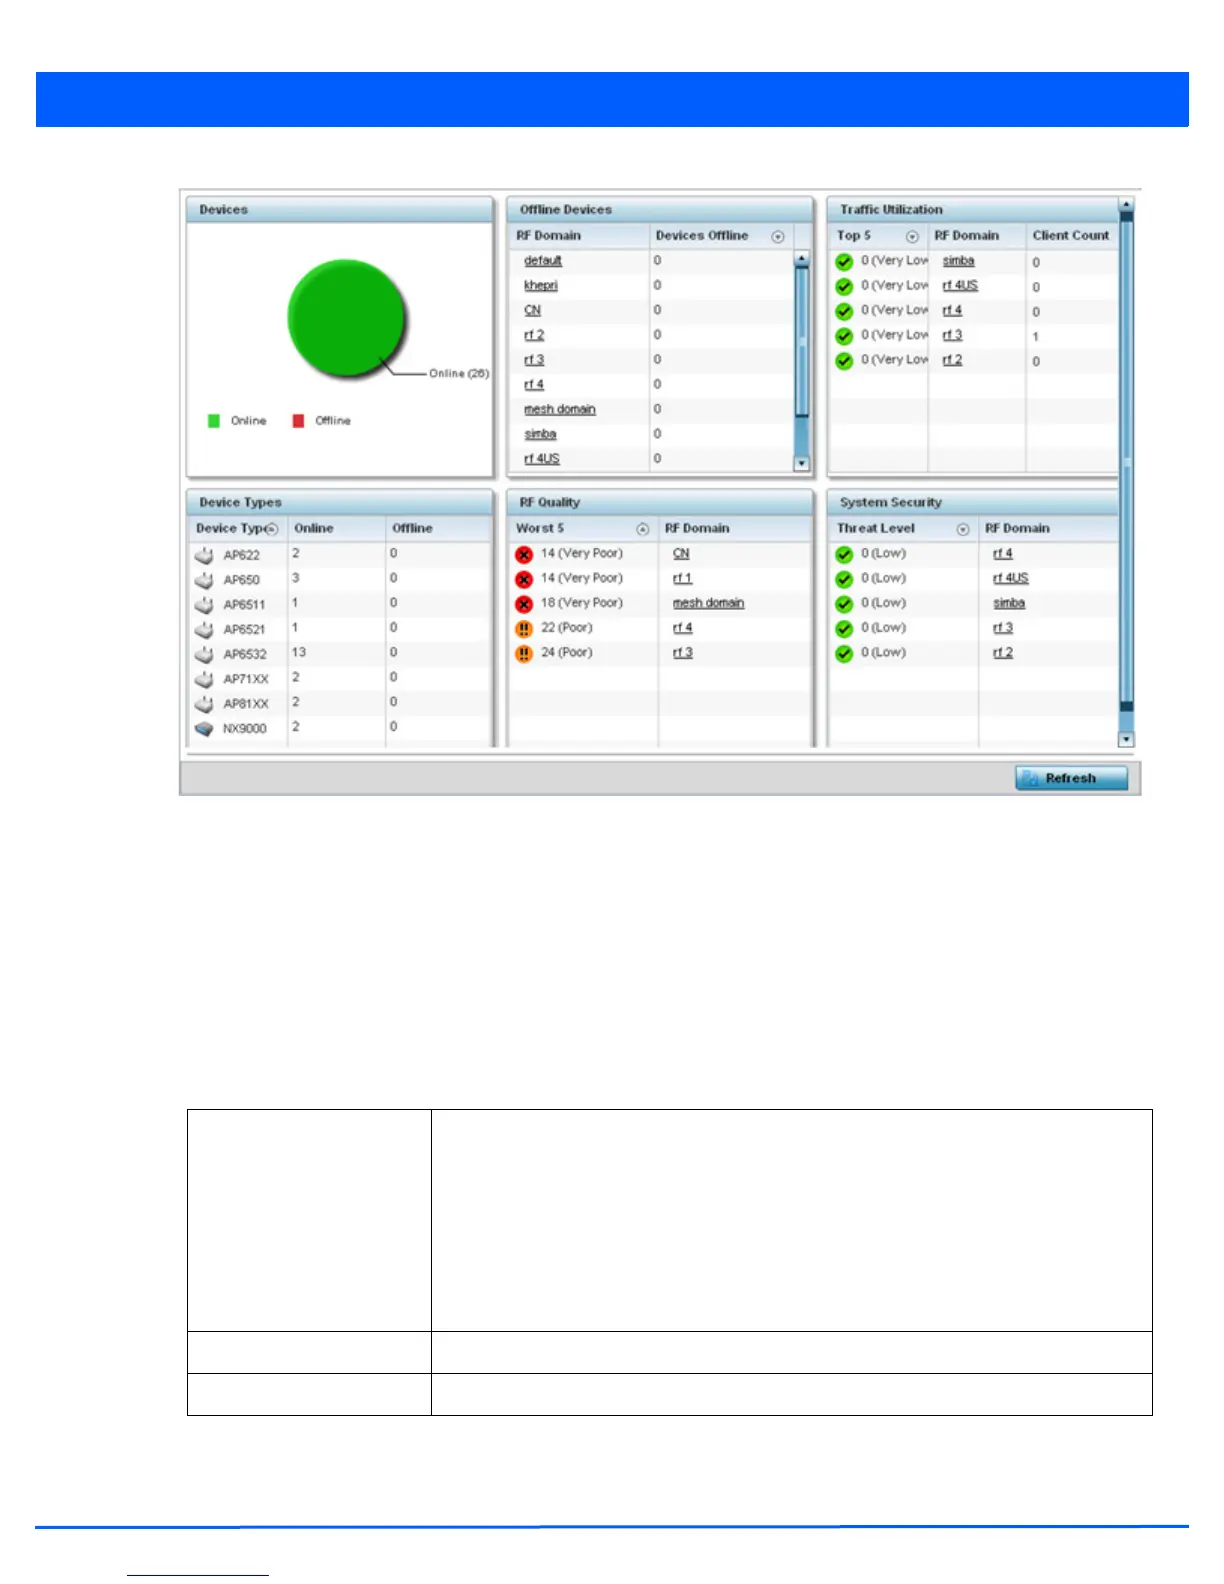
Figure 13-1 System - Health screen
4. The Devices table displays the total number of devices in the network. The pie chart is a proportional view of how many
devices are functional and currently online. Green indicates online devices and red offline devices detected within the
network.
5. The Offline Devices table displays a list of detected devices in the network that are currently offline but available as
potential managed resources.
The table displays the number of offline devices within each impacted RF Domain. Assess whether the configuration of a
particular RF Domain is contributing to an excessive number of offline devices.
6. The Traffic Utilization table displays the top 5 RF Domains with the most effective resource utilization. Utilization is
dependent on the number of devices connected to the RF Domain.
7. The Device Types table displays the kinds of devices detected within the system. Each device type displays the number
currently online and offline.
Top 5 Displays the top 5 RF Domains in terms of usage index. Utilization index is a measure of
how efficiently the domain is utilized. This value is defined as a percentage of current
throughput relative to the maximum possible throughput. The values are:
• 0-20 – Very low utilization
• 20-40 – Low utilization
• 40-60 – Moderate utilization
• 60 and above – High utilization
RF Domain Displays the name of the RF Domain.
Client Count Displays the number of wireless clients associated with the RF Domain.
 Loading...