EFA-200/-300 6 Operating modes
6-7
Evaluating the bargraph
The analog display provides support in evaluating the result. The display
scale depends on the selected measurement range.
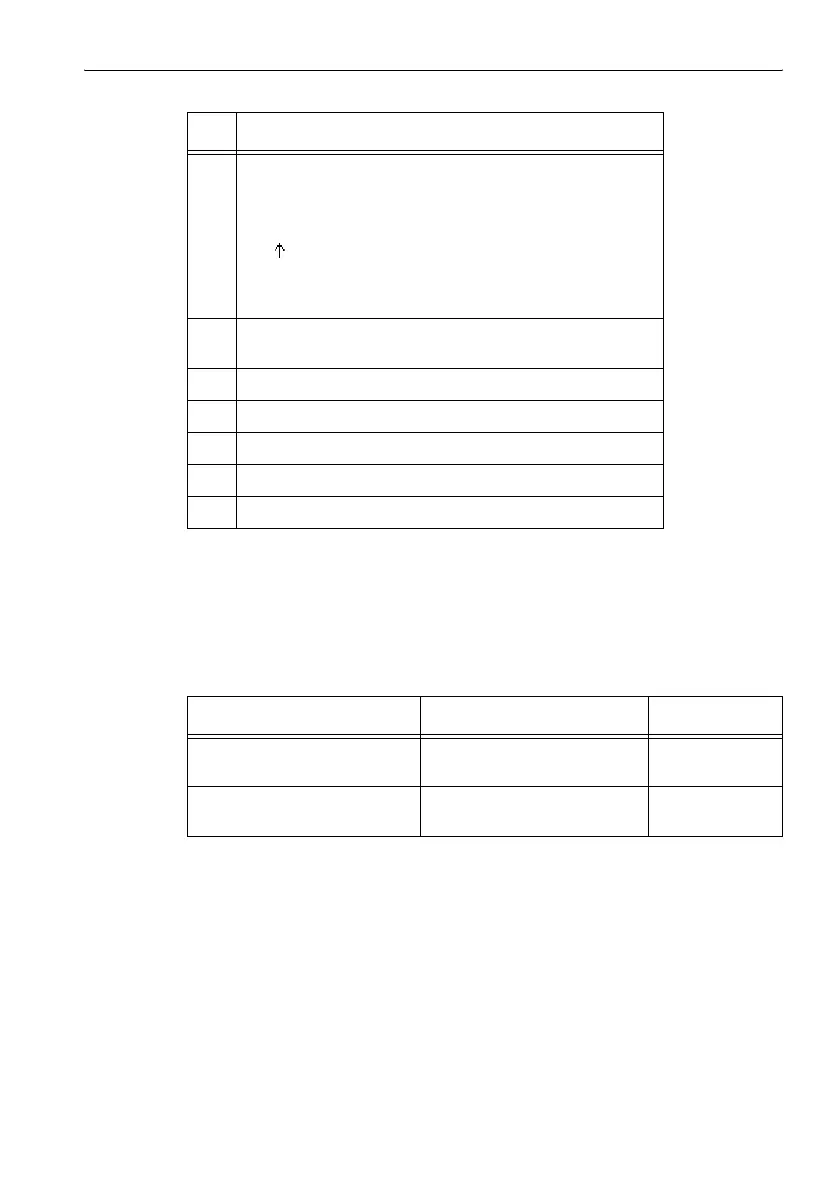
5 Result validity indicator:
• No icon: Computation of measured value complete
• “■”: Note
Internal calculation of result in progress, duration 1 sec.
• “ “: Warning
Measurement range exceeded
The selected range is unsuitable for measuring the field
under observation.
6 Frequency counter value
(for broadband filter frequency range only).
7 Display field F4: Display of selected frequency range.
8 Display field F3: Display of selected display mode.
9 Display field F2: Display of selected detection mode.
10 Display field F1: Display of selected measurement range.
11 Bargraph: Analog display of measured value.
Selected measurement range Display range Example
AUTO 10 nT to 100 mT
in logarithmic steps of 1, 2, 5
Figure 6-4, left
Fixed range
(from selection list)
(0.002 to 2) x fixed range
in logarithmic steps of 1, 2, 5
Figure 6-4, right
Table 6-3 Bargraph evaluation
No. Function
Table 6-2 Screen evaluation for Field Strength mode