6 Operating modes EFA-200/-300
6-22
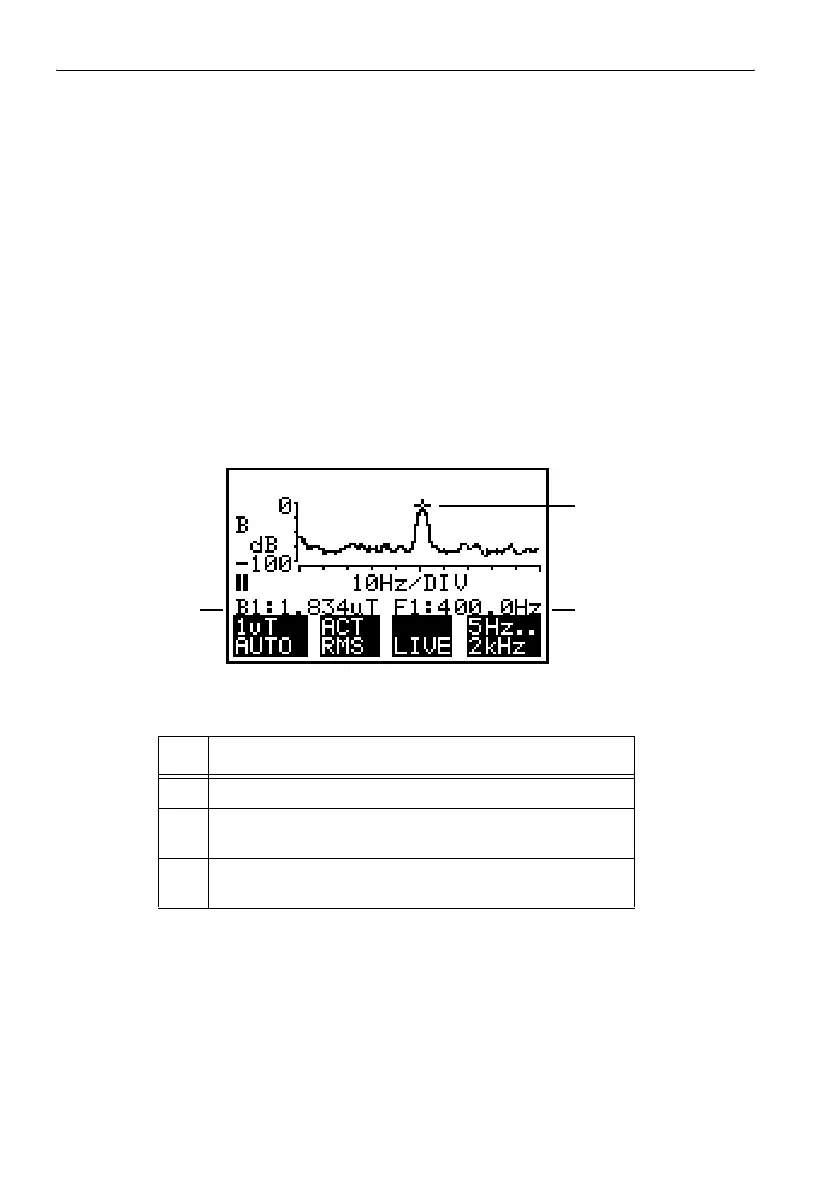
6.3.7.3 Marker
The marker is a graphical tool for displaying the nine largest measured
values within the measured frequency range. It is displayed as a signal
marker in the measurement curve and indicated numerically as a pair of
values (field strength and frequency).
Activating the marker
✓ The device should be in the “Stop” state.
✓ The measurement screen in the “Spectrum FFT” mode should be active.
⇒ Press the NEXT key.
The graphical marker for the measured value appears above the
measurement curve.
A status bar with the field strength and frequency of the measured value
is inserted below the frequency axis. The value pair has an index.
Figure 6-10 Measurement screen with the marker
No. Function
1 Graphical marker
2 Frequency of the spectral line indicated by the marker. An
index of 1 is given here as an example.
3 Measured value of the spectral line indicated by the
marker. An index of 1 is given here as an example.
Table 6-6 Elements of the measurement screen with the marker
3
2
1