Monitoring System Access and Performance
438
ProSecure Unified Threat Management (UTM) Appliance
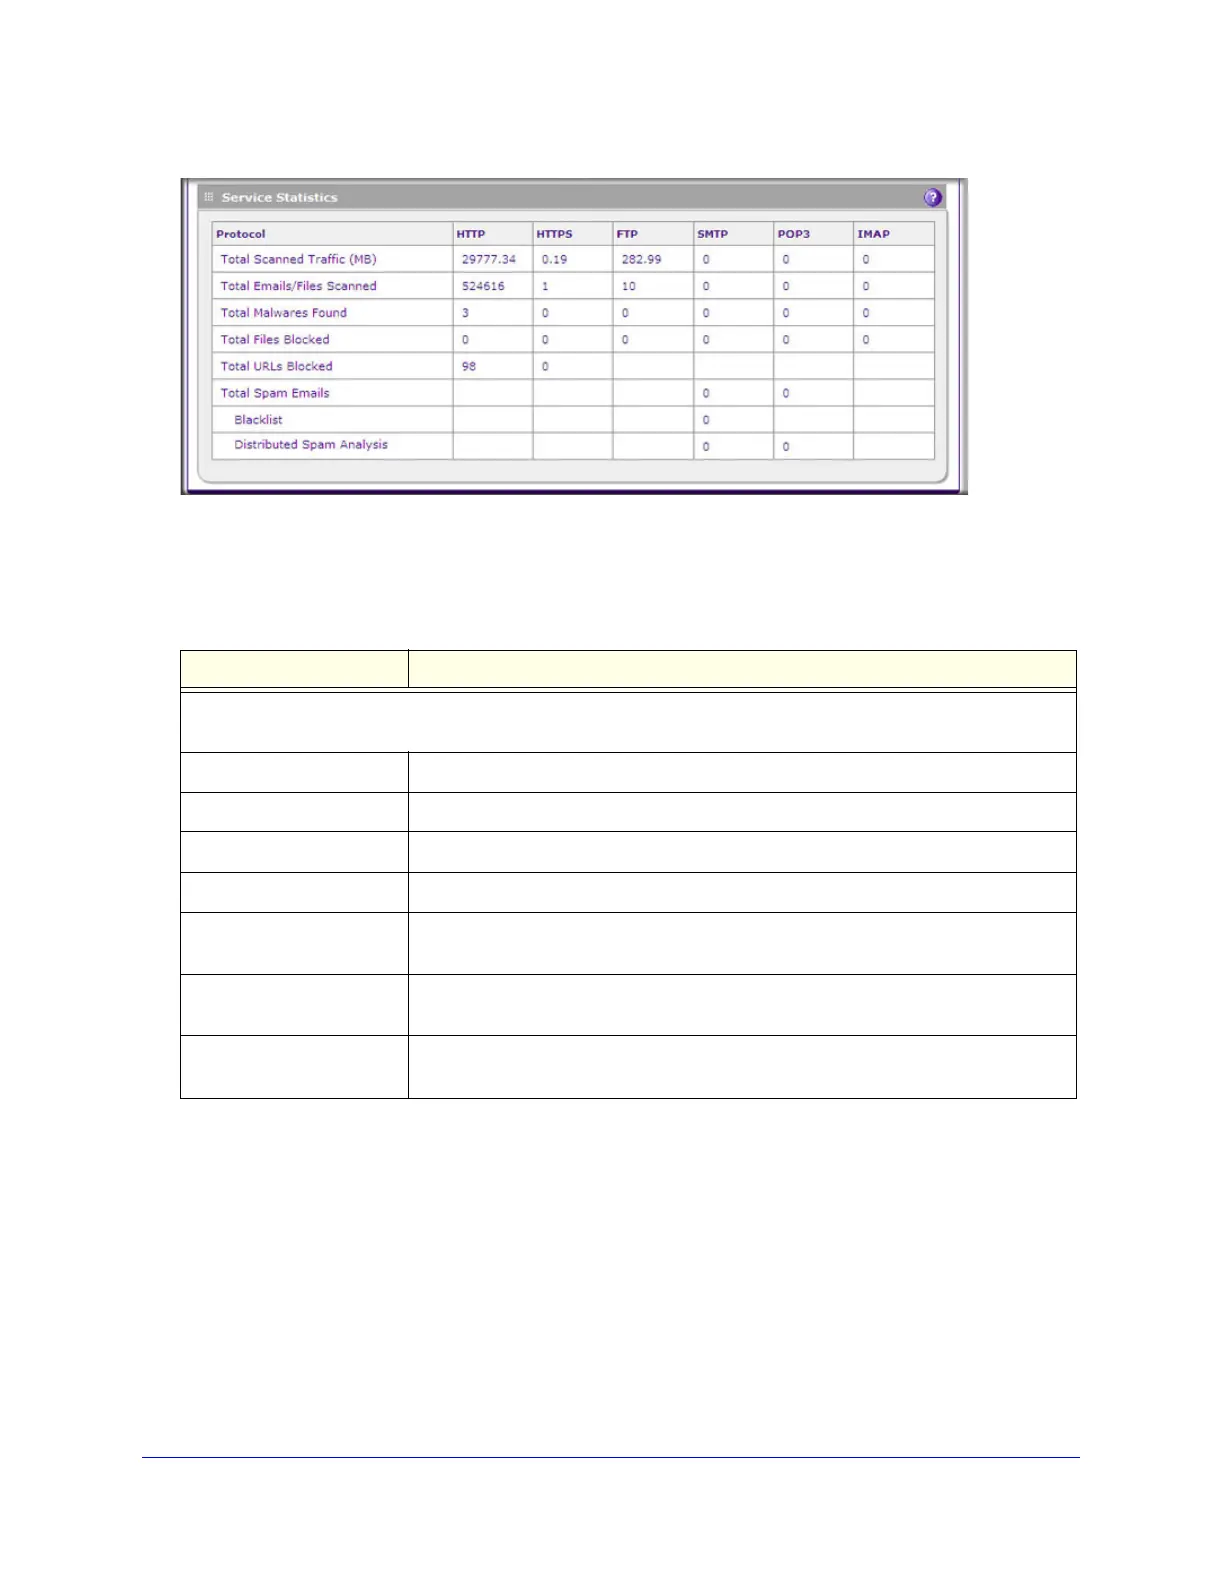
Figure 259. Dashboard, screen 3 of 3
The following table explains the fields of the Service Statistics section of the Dashboard
screen:
Table 111. Dashboard screen: service statistics information
Item Description
For each of the six supported protocols (HTTP, HTTPS, FTP, SMTP, POP3, and IMAP), this section provides the
following statistics:
Total Scanned Traffic (MB) The total quantity of scanned traffic in MB.
Total Emails/Files Scanned The total number of scanned emails.
Total Malwares Found The total number of detected viruses and attacks.
Total Files Blocked The total number of files that were blocked from being downloaded.
Total URLs Blocked The total number of URL requests that were blocked. These statistics are
applicable only to HTTP and HTTPS.
Total Malware Quarantined UTM9S only (information is not shown in the previous figure). The total number of
viruses (attachments, objects and web files) that were quarantined.
Total Spam Quarantined UTM9S only (information is not shown in the previous figure). The total number of
spam messages that were quarantined.
 Loading...