Monitoring System Access and Performance
480
ProSecure Unified Threat Management (UTM) Appliance
Schedule, Email, and Manage Reports
To schedule automatic generation and emailing of reports:
1. Select Monitoring > Logs & Reports > Report. The Report screen displays. (The
following two figures show only the Schedule Reports and Report History sections of the
Report screen.)
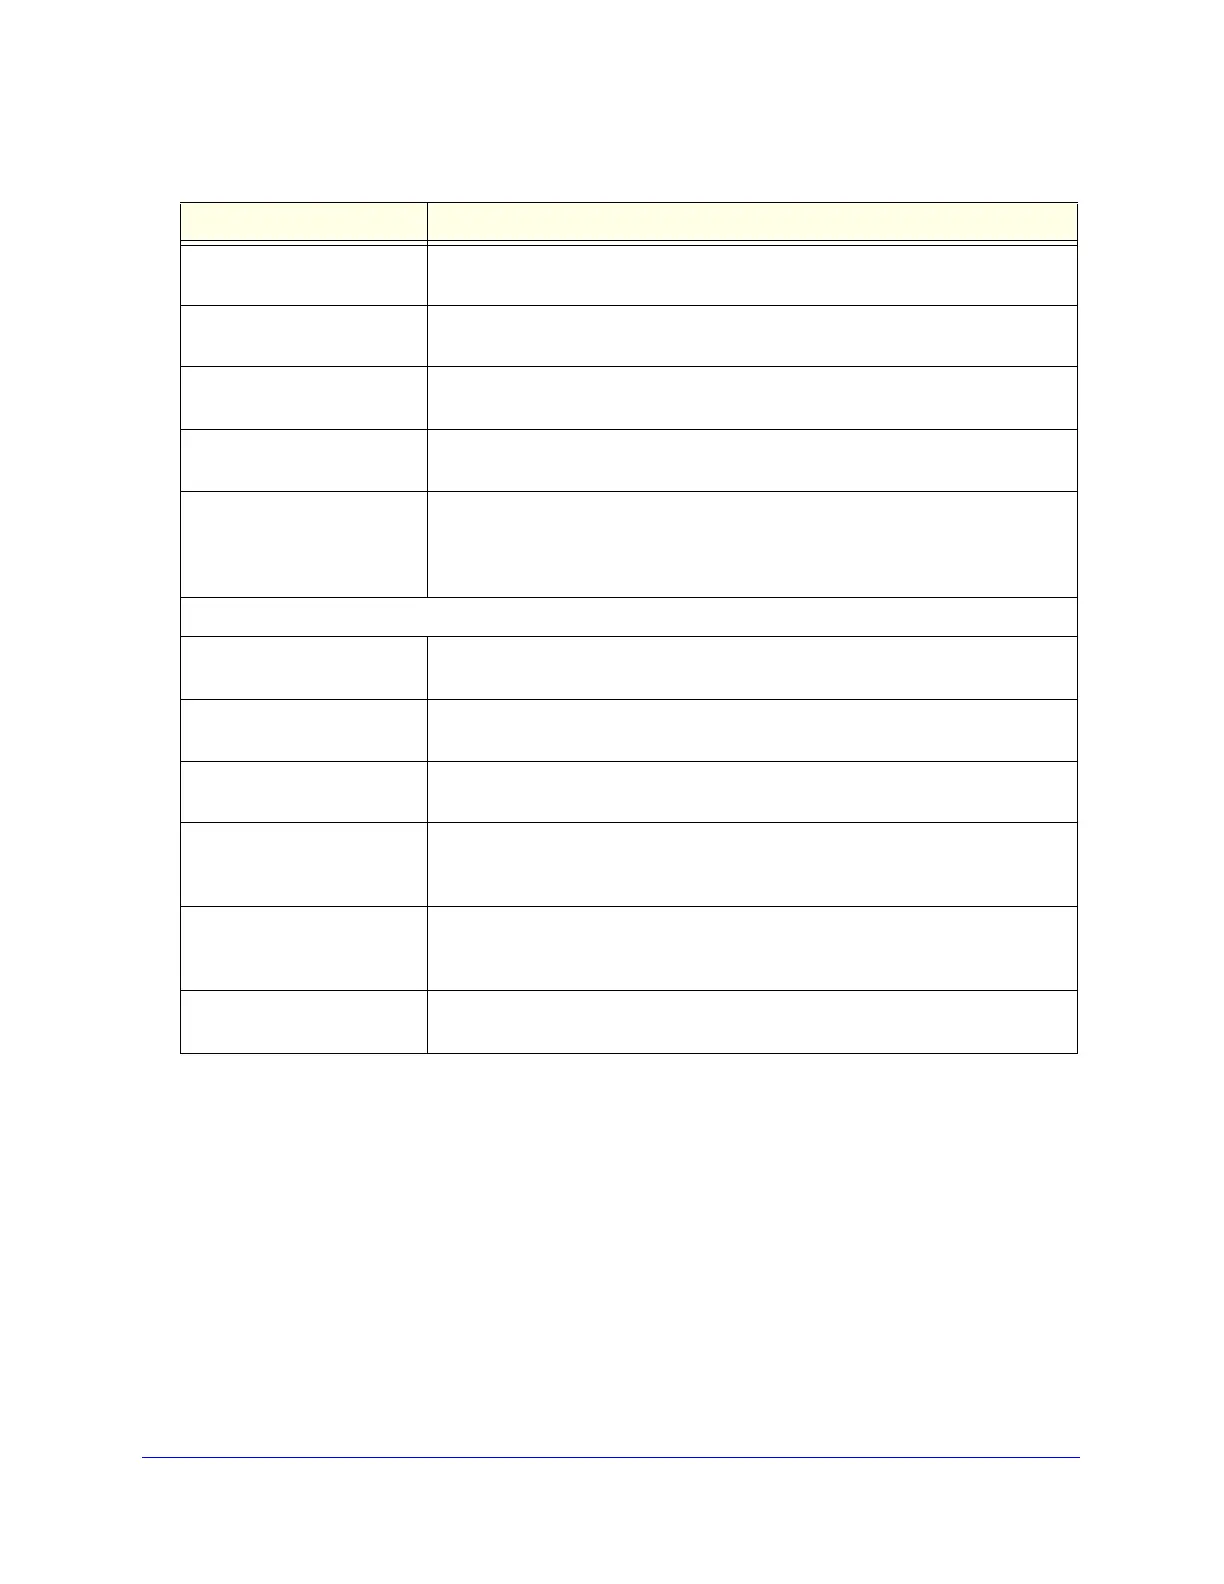
File Blocked By Time For each of the three email server protocols separately, a chart and a table with
the number of blocked files (attachments).
Spams By Time For the POP3 and SMTP protocols separately, a chart and a table with the
number of spam emails that are detected by distributed spam analysis.
Requests By Time For each of the three email server protocols separately, a chart and a table with
the number of processed emails.
Traffic By Time For each of the three email server protocols separately, a chart and a table with
the processed traffic, expressed in bytes.
Blacklist By Time For the POP3 and SMTP protocols separately, a chart and a table with the
number of blocked emails from email addresses that are on the blacklist, and for
the SMTP protocol only, a chart and a table with the number of blocked emails
from email addresses that are on the real-time blacklist (RBL).
System
Total Bandwidth Usage By
Time
A chart and a table with the consumed bandwidth, expressed in bytes.
Top n User By Bandwidth A chart and a table with the IP addresses that consume most bandwidth,
expressed in bytes.
Total Malware Incidents By
Time
For email and web traffic separately, a chart and a table with the number of
detected malware incidents.
Top n Malwares For email and web traffic separately, a chart and a table with the names of the
malware that were detected most often, including the number of times that they
were detected.
Top n Infected Clients For email and web clients separately, a chart and a table with the IP addresses of
the clients that were infected by malware most often, including the number of
times that they were infected.
CPU & Mem Usage For the UTM’s CPU and memory separately, a chart and a table with the usage,
expressed in percentage.
Table 126. Report screen: report template information (continued)
Report template Information reported for the specified time range
 Loading...